Wednesday, April 29, 2015

Facebook ($FB) - The Anatomy of an Ichimoku Cloud Trade

Weekly Chart

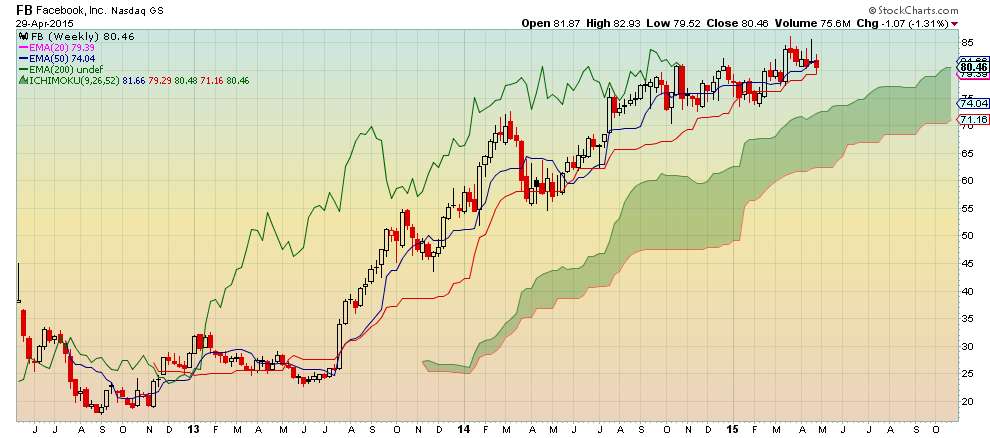
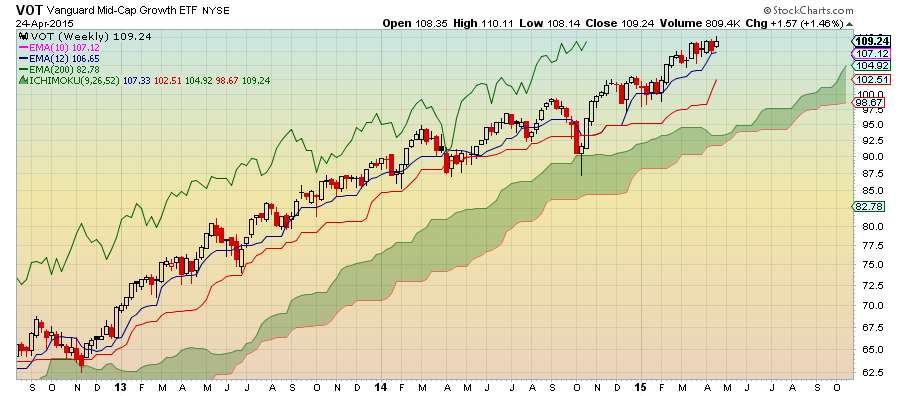
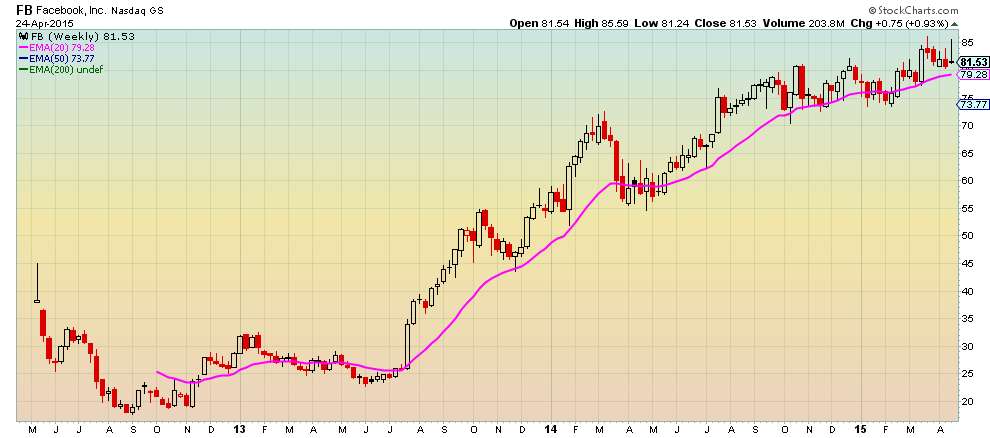
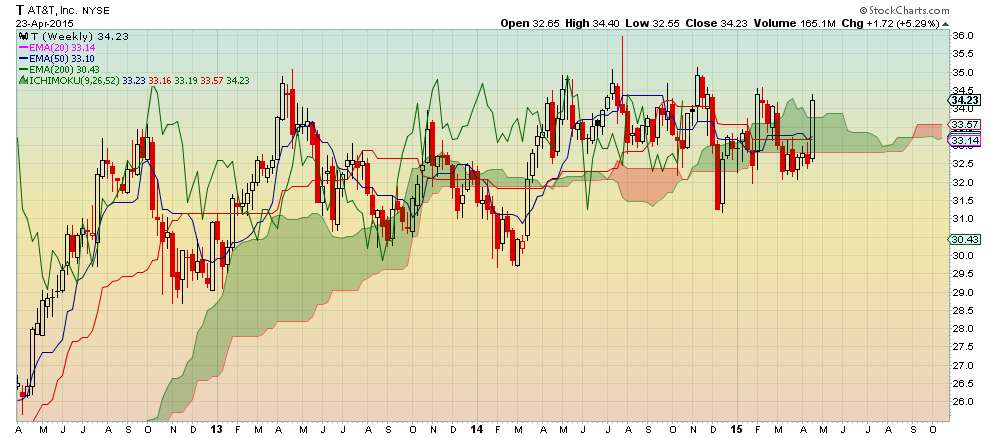
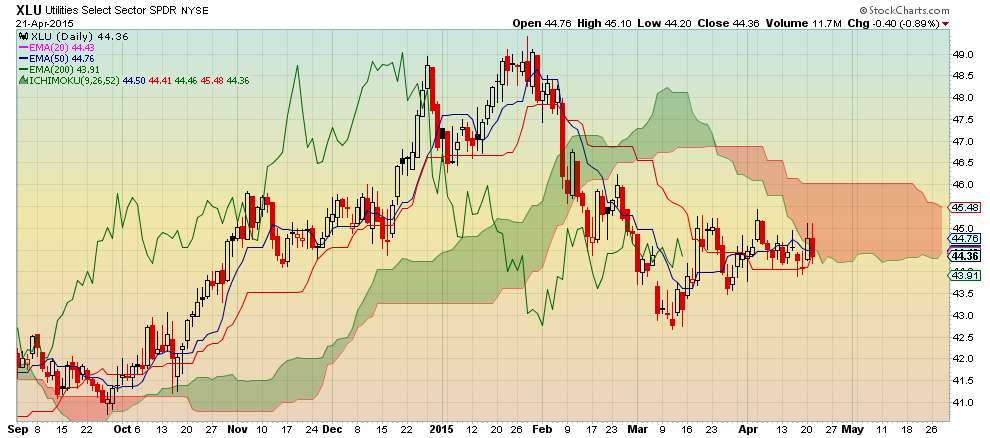
Weekly chart shows that $FB is in an uptrend (bullish).

Price is between Tenkan Sen (blue line) and Kijun Sen (red line) with Kijun Sen acting as support which suggests a pullback in an uptrend.
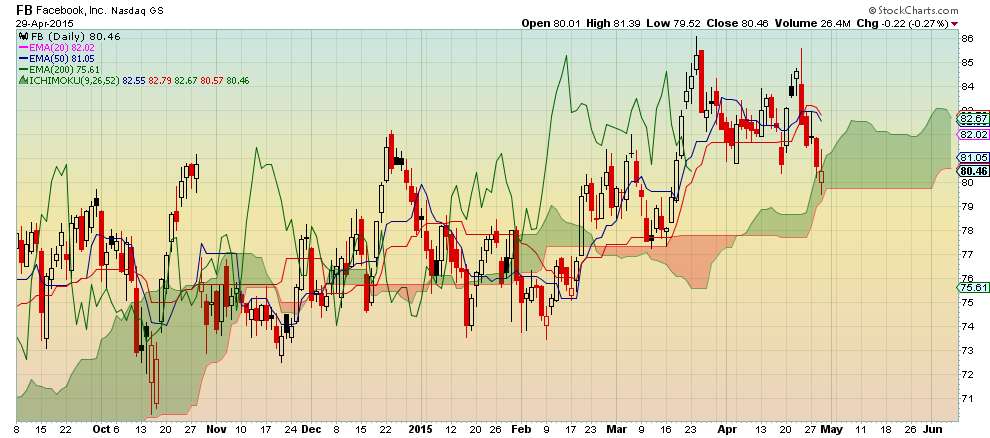
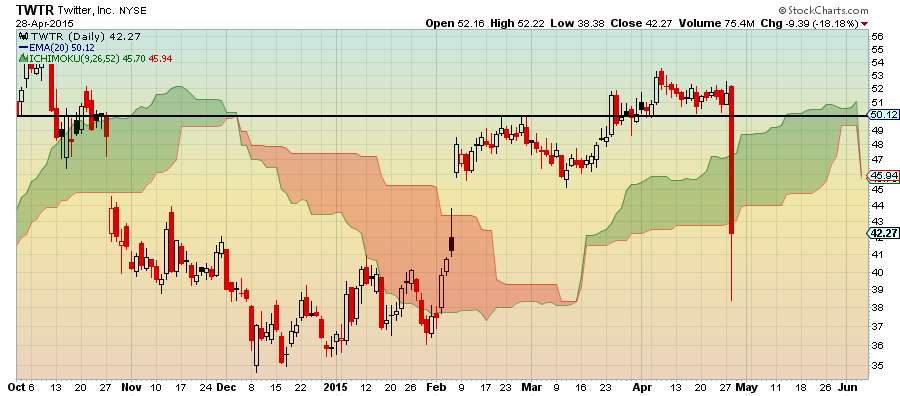
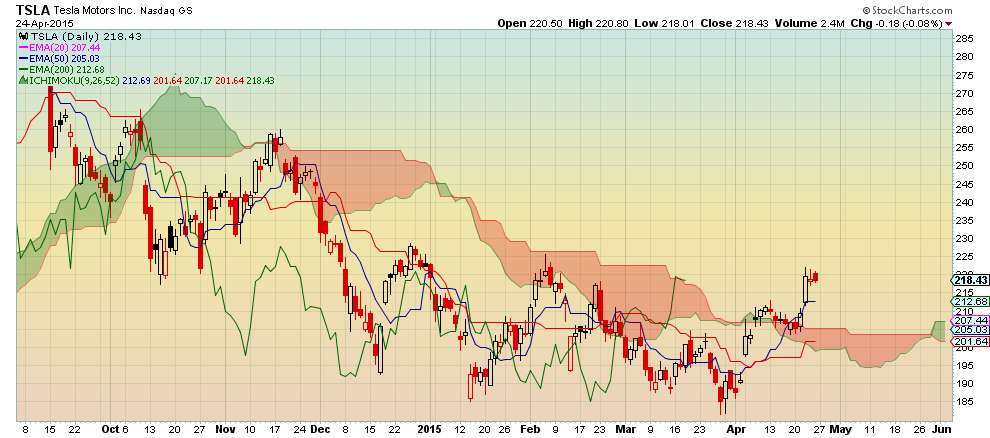
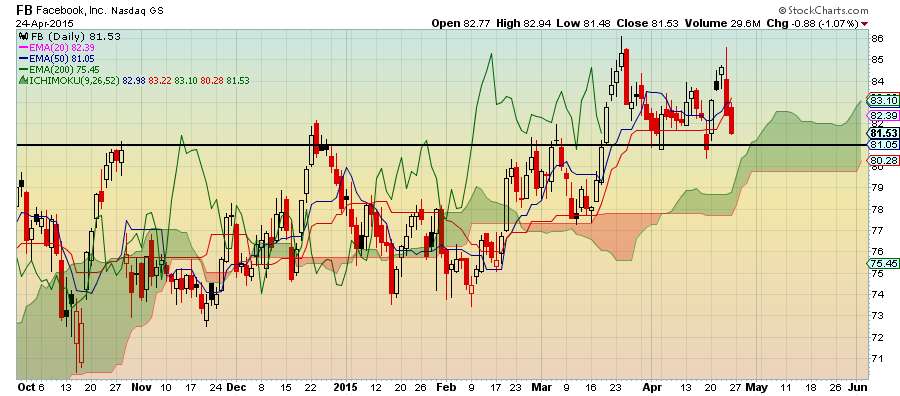
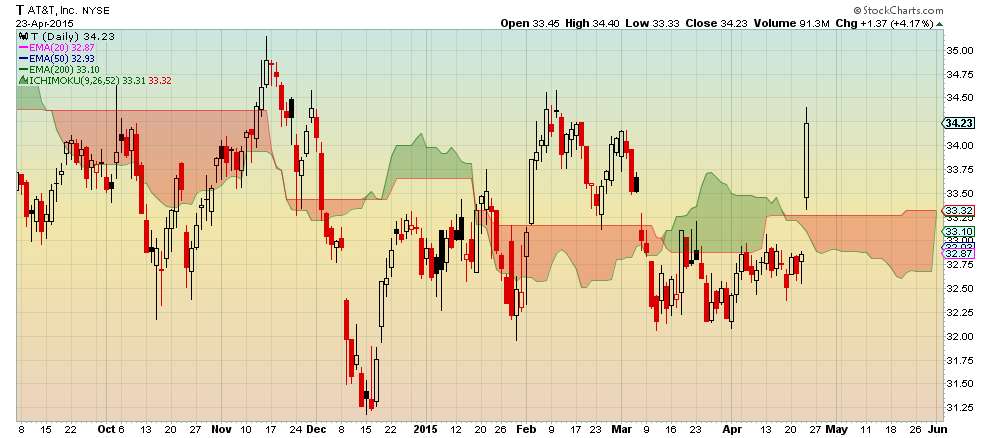
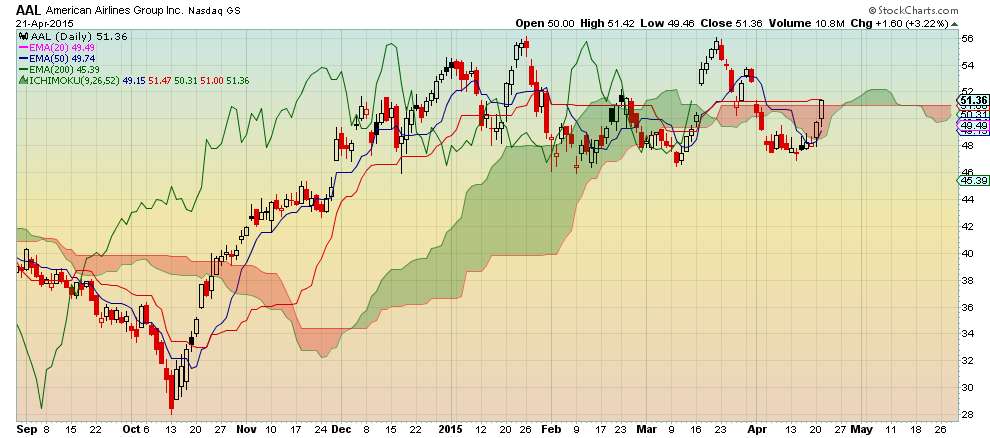
Visit StockCharts.com to see more great charts.

Daily Chart

$FB enters Ichimoku Cloud revealing uncertainty and potential cloud support. Candle closes higher than open which suggests a pullback may be in place.
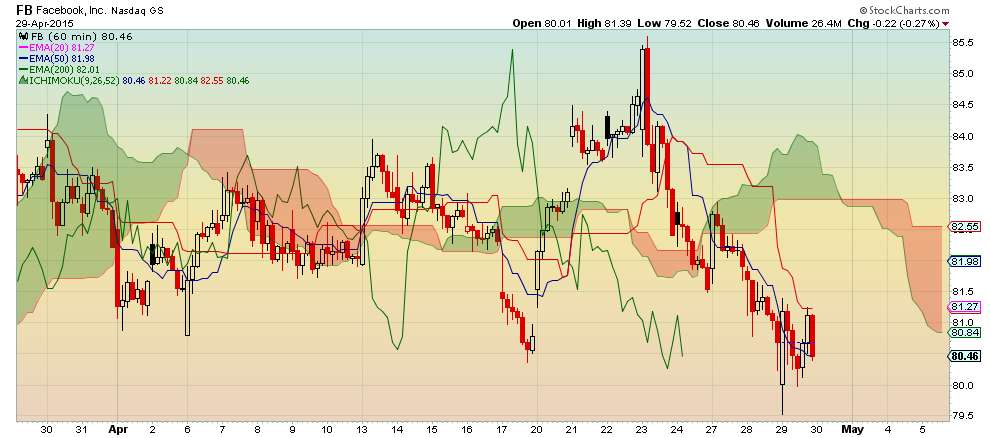
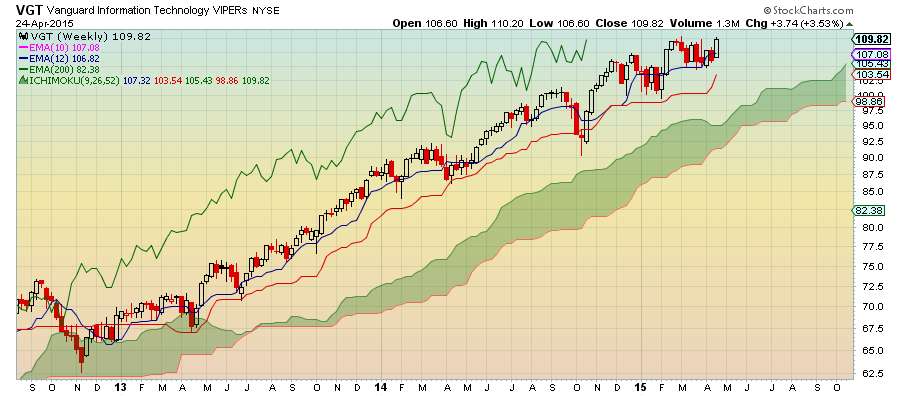
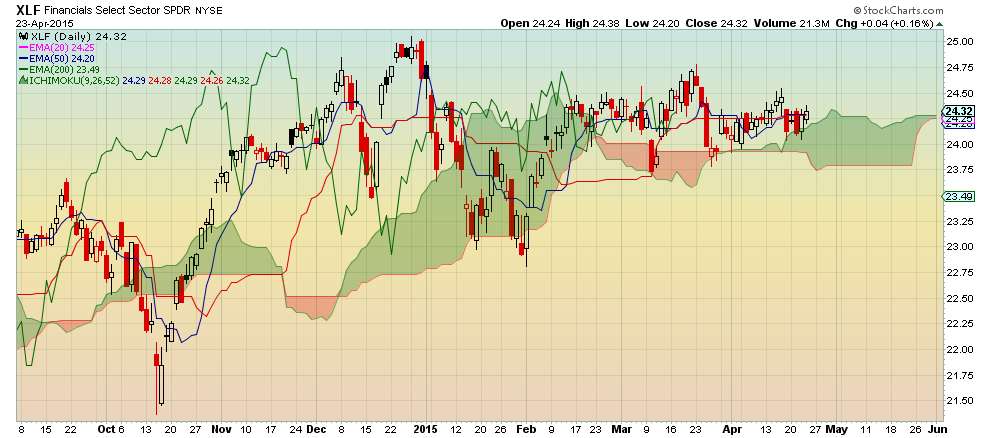
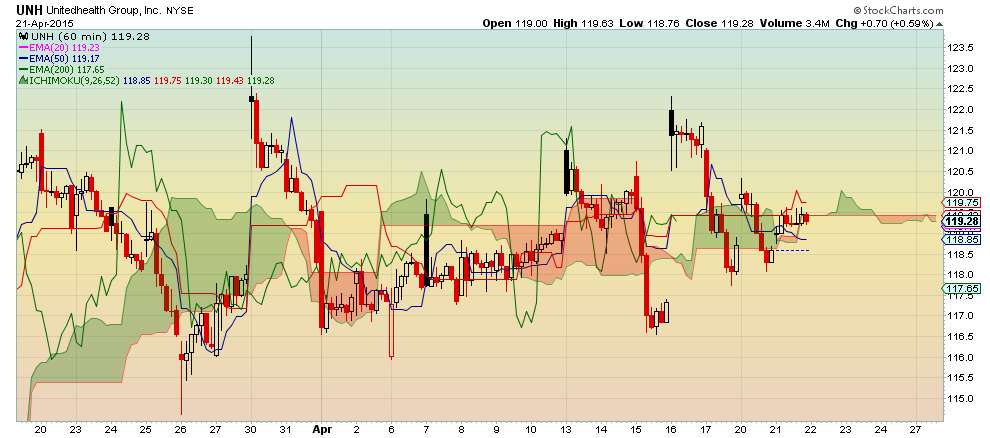


Visit StockCharts.com to see more great charts. Hourly Chart
Current price is below Ichimoku Cloud and Tenkan Sen is below Kijun Sen which is bearish.
Pullback is confirmed with price showing support.

Visit StockCharts.com to see more great charts. Recommendation Determine amount to invest in $FB by keeping investment below 5% of total capital. Scale into $FB.

$TWTR - A look back since the IPO (updated)

Flat Ichimoku Cloud reveals $TWTR has gone no where and sentiment is bearish.


Visit StockCharts.com to see more great charts.

Sunday, April 26, 2015

Dow Jones Airlines Index - Delta Air Lines bringing up the rear just like old times

I remember their execs saying it was different this time like all the ones before them.

Visit StockCharts.com to see more great charts.

Microsoft ($MSFT) blasts through the Ichimoku Cloud

Results that exceeded analyst expectations catapults $MSFT up over 10%.


Visit StockCharts.com to see more great charts.

Facebook ($FB) closed below Kijun Sen on daily chart which is bearish

The signal is considered to be weak sinced it occurred above the cloud.


Visit StockCharts.com to see more great charts.

Dow Transports are at the cusp of breaking through the Ichimoku Cloud

 The index has traded sideways since December as revealed by the flat cloud.  A break above the cloud with a change from red to green may signal a new trend.

Visit StockCharts.com to see more great charts.

Friday, April 24, 2015

$VIX declines to lowest level in 2015 as the market sets a new high

Don't be afraid to take some profits. The odds start to favor an increase in the $VIX when it reaches low levels which means the odds for a market pullback increase as well.


Visit StockCharts.com to see more great charts.

S&P 500 sets a new record

Ichimoku Cloud issued a strong bullish signal on April 14.


Visit StockCharts.com to see more great charts.

Tuesday, April 21, 2015

Vanguard REIT Index ($VNQ) - Alert

$VNQ has underperformed the S&P 500 over the last 3-months and has about matched it for the last 6-months. If it underperforms for a 1-year period it's time to re-balance to the S&P 500 or a higher performing asset.


Visit StockCharts.com to see more great charts.

American Airlines ($AAL) issues bullish signal with price closing above the Kumo (cloud)

Chikou Span (green line) crossing the price curve serves as additional confirmation of  the signal although it is not as strong since the cross occurred below the cloud. Scale in as usual.  The flat top cloud and future cloud imply a potential for sideways trading.


Visit StockCharts.com to see more great charts.T