Sunday, August 30, 2015
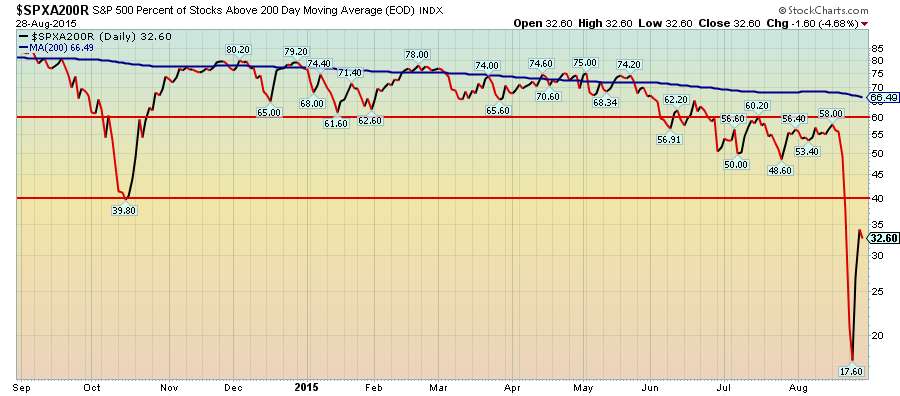
Almost 67% of S&P 500 stocks are below their 200 day moving average
- 33% of S&P 500 stocks are above their 200 day moving average
- The red lines at 60% and 40% mark bull and bear territory for me
- The % must rise and get above 60% for a reversal
Saturday, August 29, 2015
Sunday, August 23, 2015
Saturday, August 22, 2015

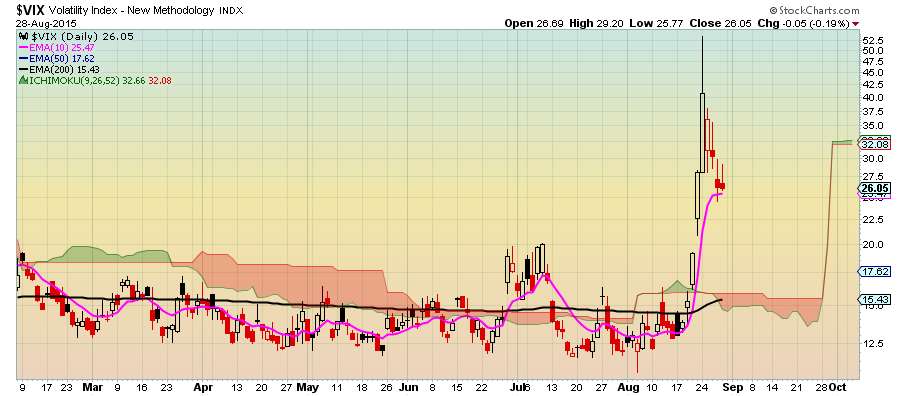
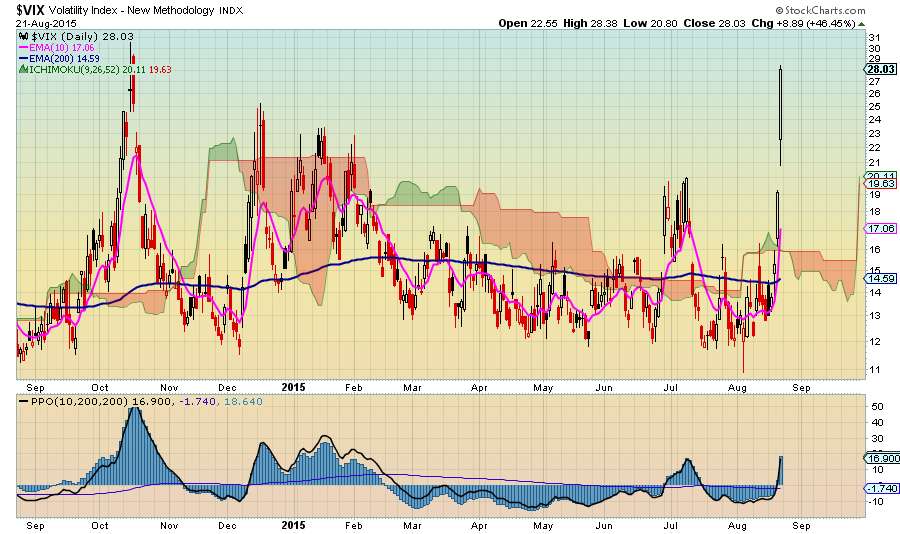
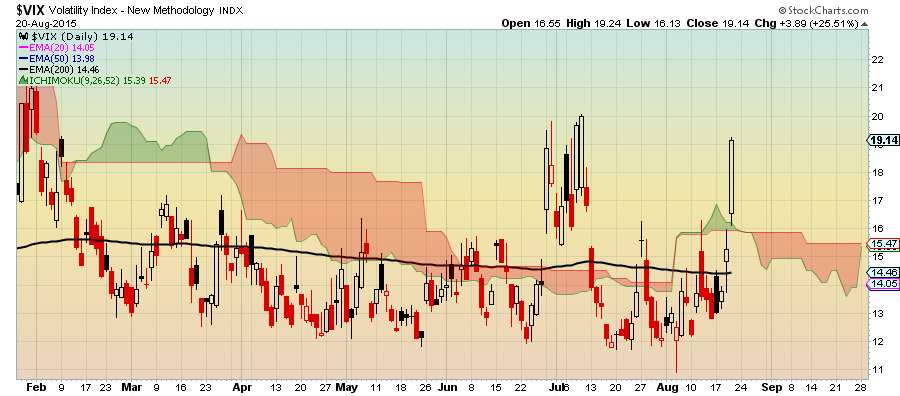
$VIX is slightly below last October's high and a break above it will ensure more carnage
If $VIX starts to decline it may be an opportunity to buy the dip.
Friday, August 21, 2015

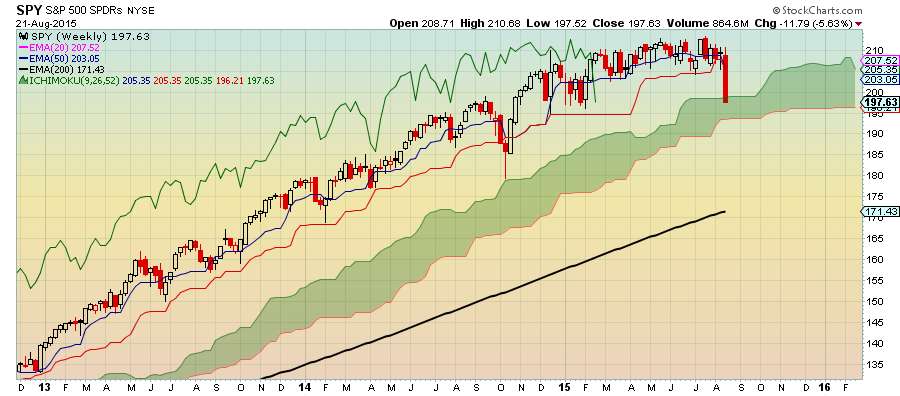
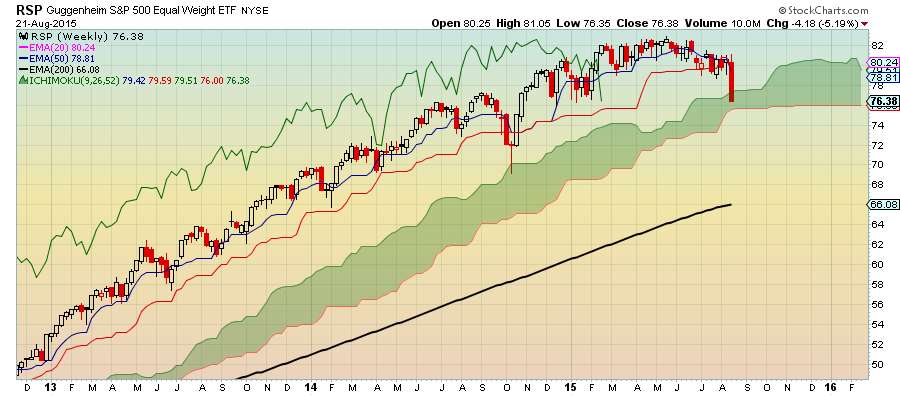
$RSP - Average S&P 500 stock is in correction territory
$RSP has support at 76. A break below it will turn things from bad to worse.
Thursday, August 20, 2015
Fear Guage ($VIX) blasts off like a bottle rocket so monitor it for an opportunity to BUY into the market by scaling in
Don't try to catch a falling knife, but when $VIX starts to lose momentum it has proven to be a good time to BUY into the market
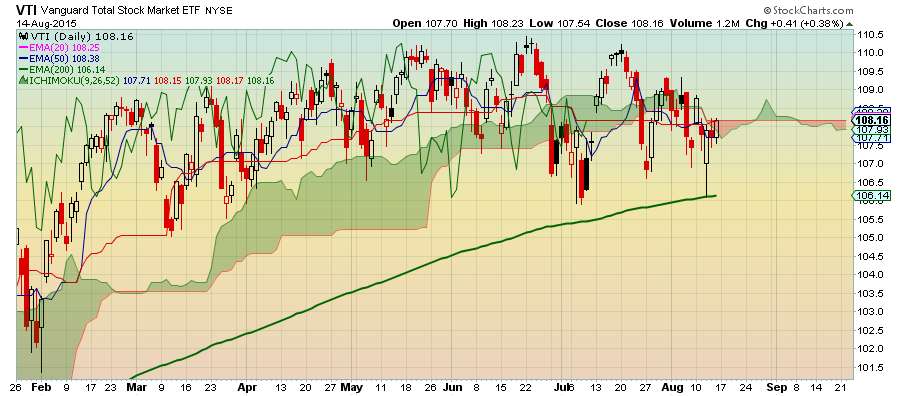
Monday, August 17, 2015
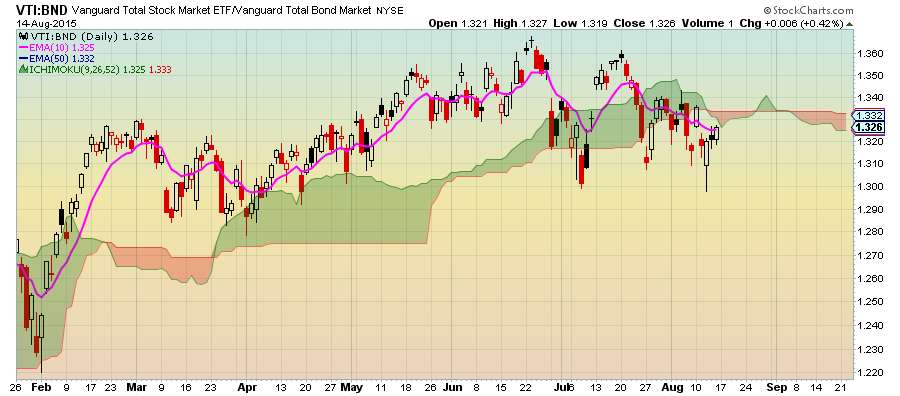
$VTI may issue a buy signal tomorrow if it closes higher
- Scale in since leading cloud is bearish and flat
- Keep eye on Chikou Span
- Conservative investors should wait until Tenkan Sen crosses Kijun Sen and both lines are above the cloud


Sunday, August 16, 2015


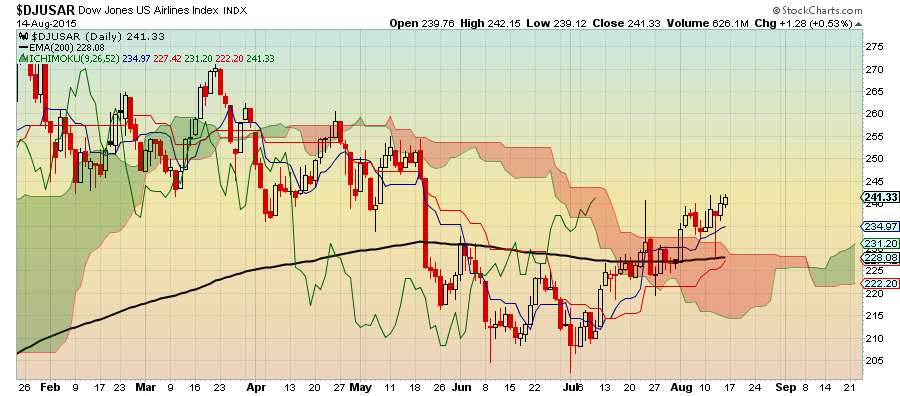

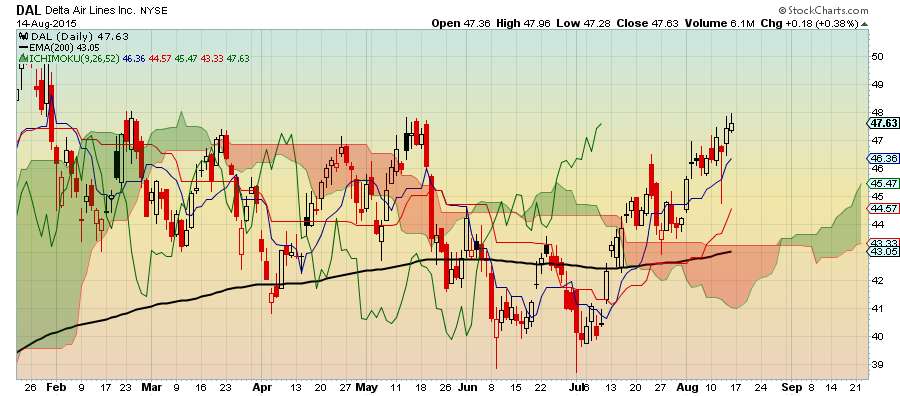
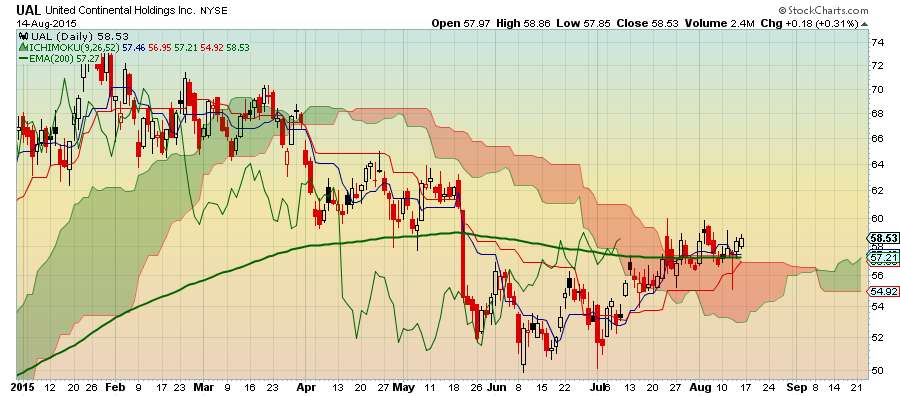
$UAL issues buy signal with breakout above the cloud and 200 EMA
- Scale in since Kijun Sen (red line) and Chikou Span haven't cleared the cloud yet