Monday, September 28, 2015
Friday, September 25, 2015
Sunday, September 20, 2015
Saturday, September 12, 2015

Monday, September 7, 2015
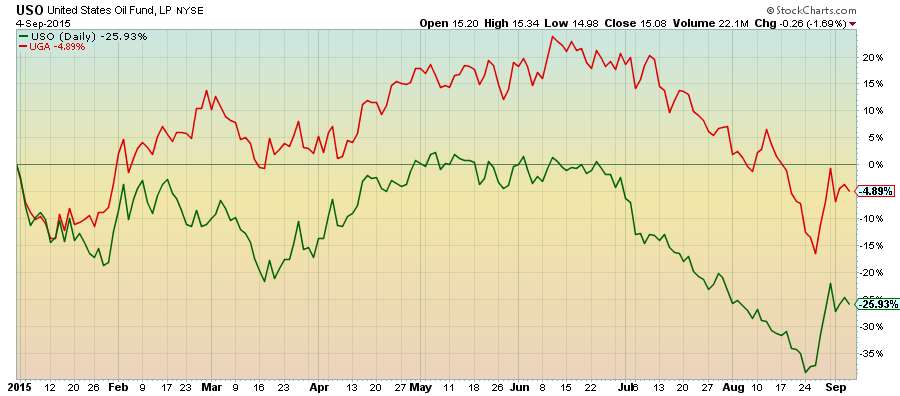
Year-to-date change in $USO and $UGA indicates consumers get fleeced both ways
Gas price changes always lag oil price changes when oil declines and lead when oil rises.
 Spot Price for Brent Crude Oil vs. Spot Price for Unleaded Gasoline
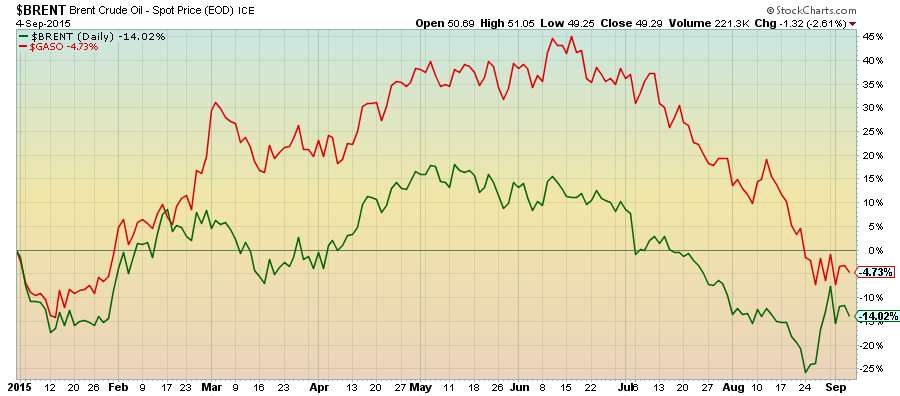
Spot Price for Brent Crude Oil vs. Spot Price for Unleaded Gasoline
Year-to-date change in oil and gas prices shows that gas price changes lag when oil drops, but lead when oil rises
Spot Price for Brent Crude Oil vs. Spot Price for Unleaded Gasoline
Gas price changes always lag oil price changes when oil declines and lead when oil rises.
Gas price changes always lag oil price changes when oil declines and lead when oil rises.
Sunday, September 6, 2015
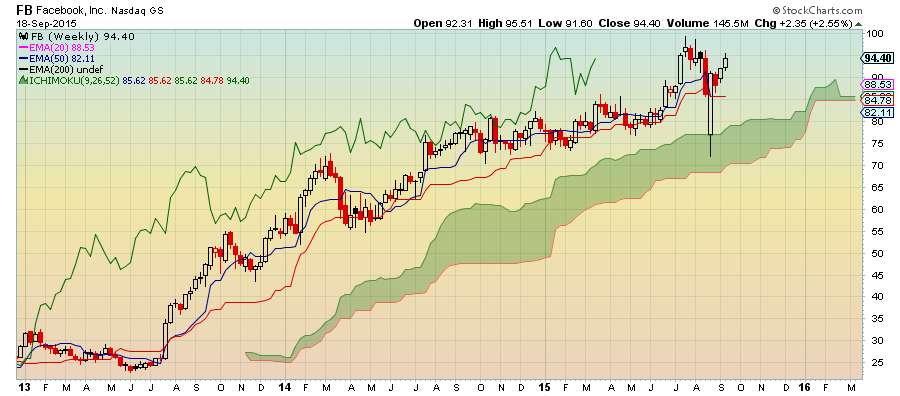
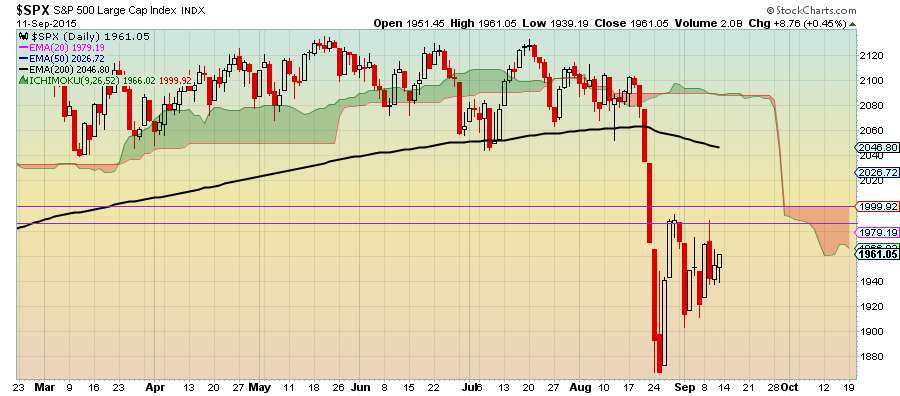
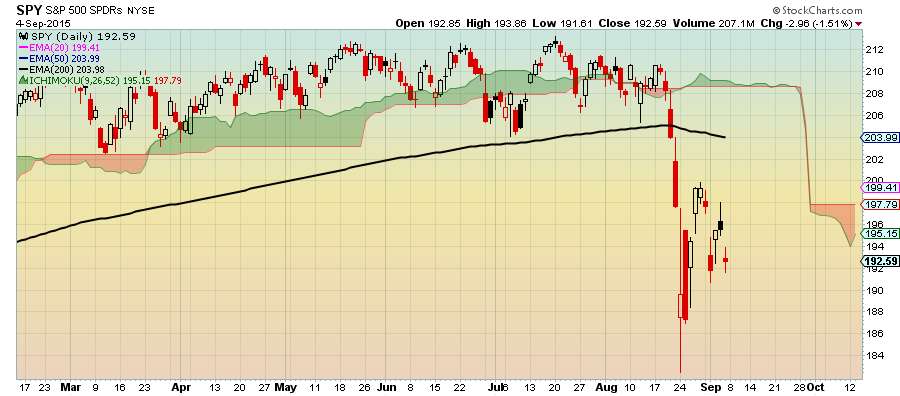
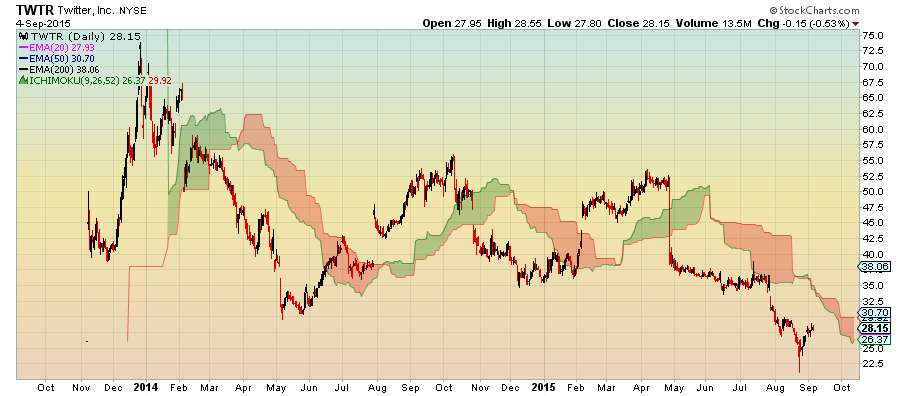
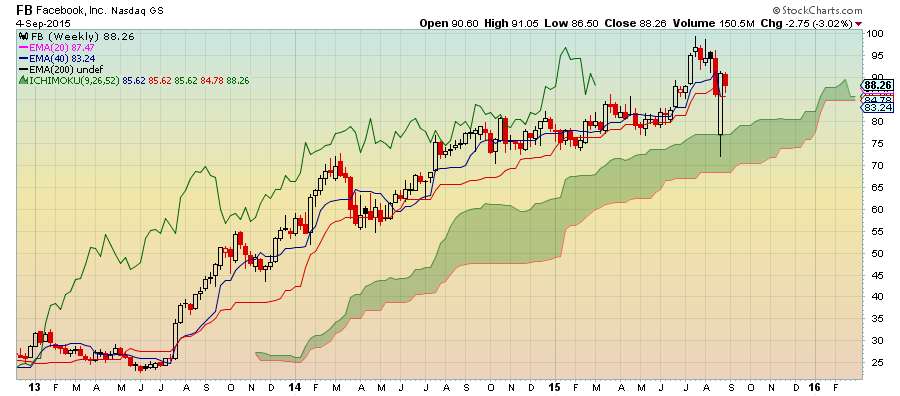
A lot of stocks mimic this bearish pattern
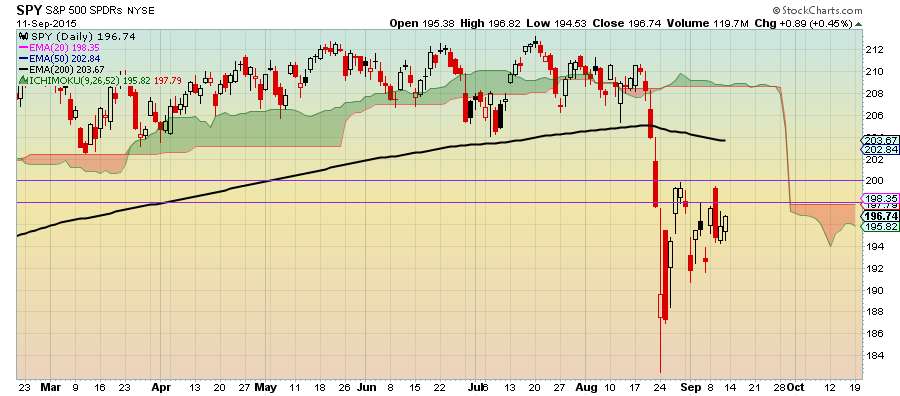
Bearish Pattern
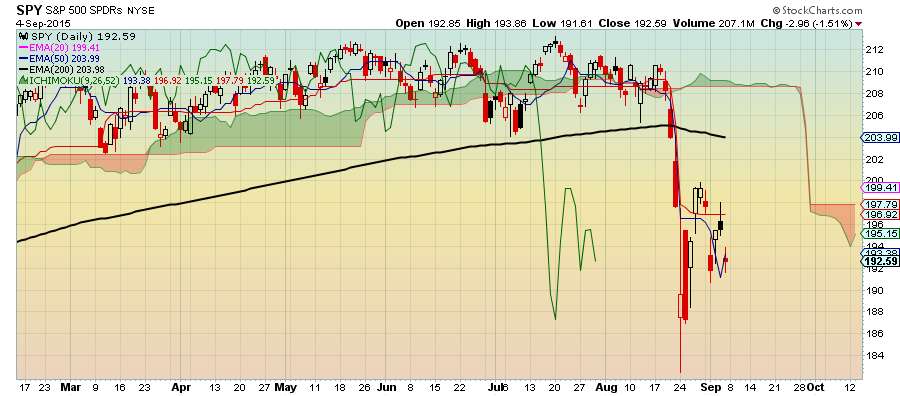
- All Ichimoku Cloud elements are bearish:
- Price, Tenkan Sen, Kijun Sen, Chikou Span are below the cloud and below the stock's 200 day moving average
- Tenkan Sen is below Kijun Sen
- Senkou Span A is below Senkou B
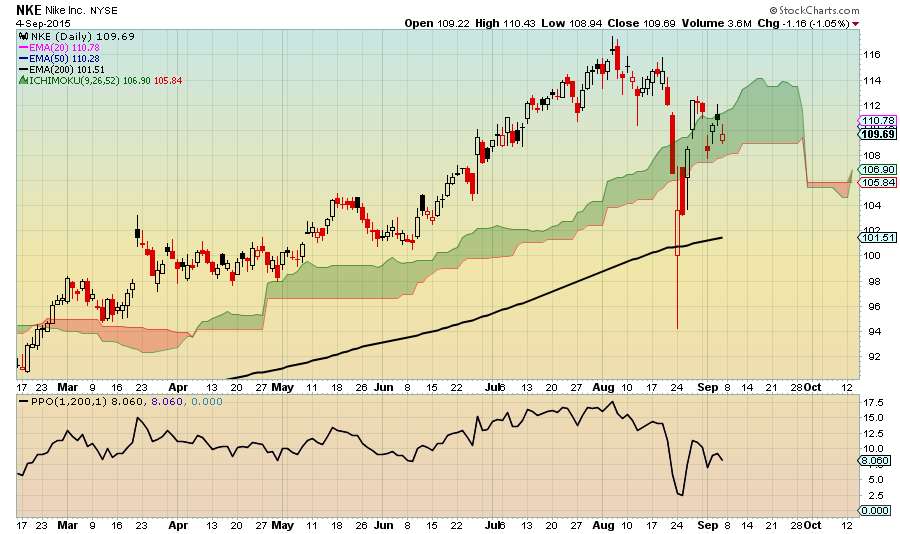
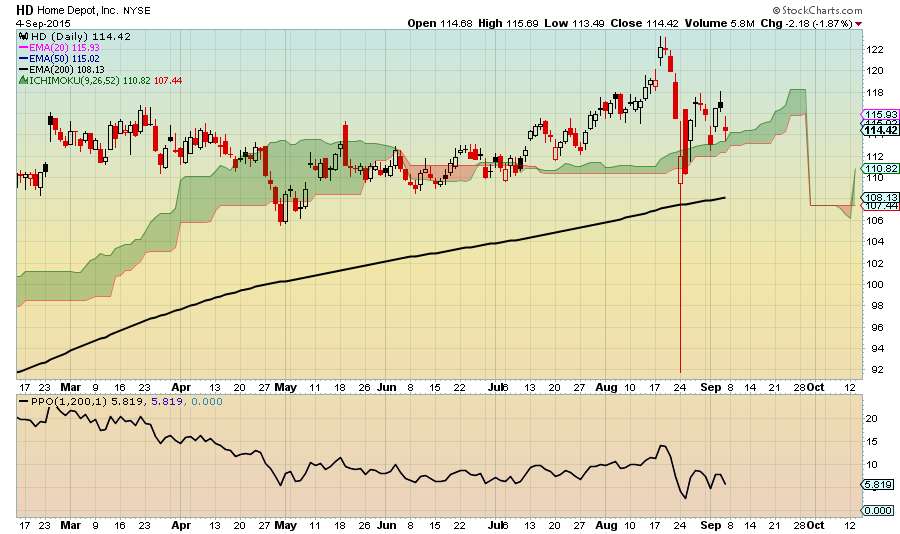
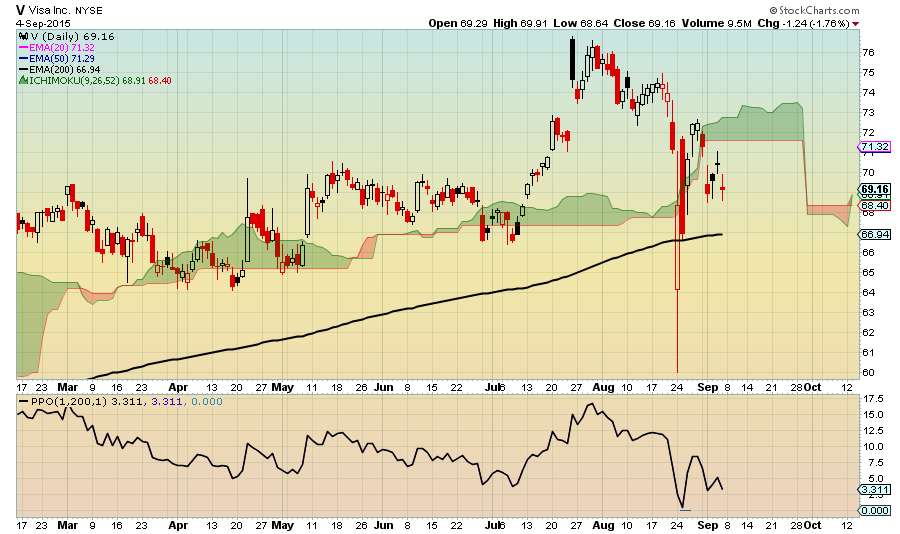
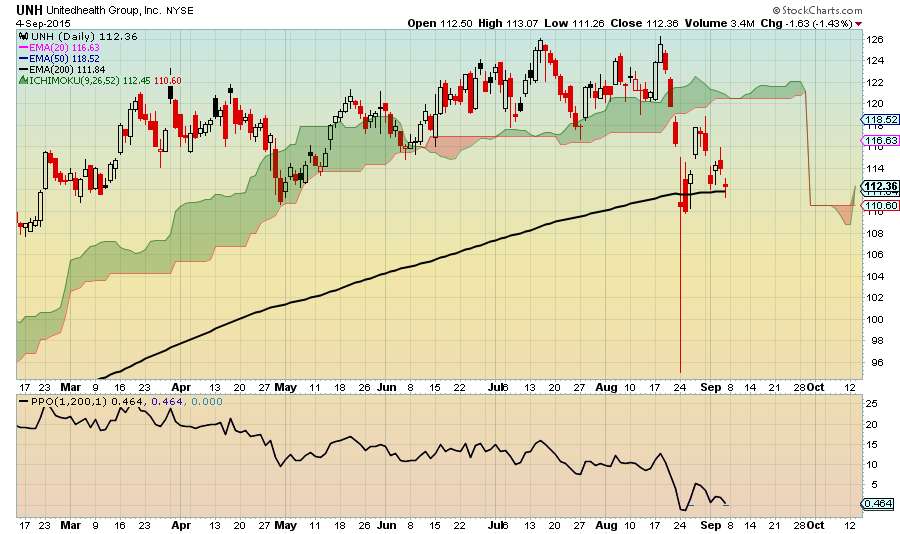
The only Dow stocks above their 200 day moving average (4 of 30)
#1 Nike
#2 Home Depot
#3 VISA
#4 UnitedHealth Group
Saturday, September 5, 2015
I always make a 8 month bet on $UNG around this time of the year
- Inventory is above the 5-year average, but less than it was a year ago
- This tells me to not buy above $13/share and keep my fingers crossed that it will be very cold in certain parts of the U.S.

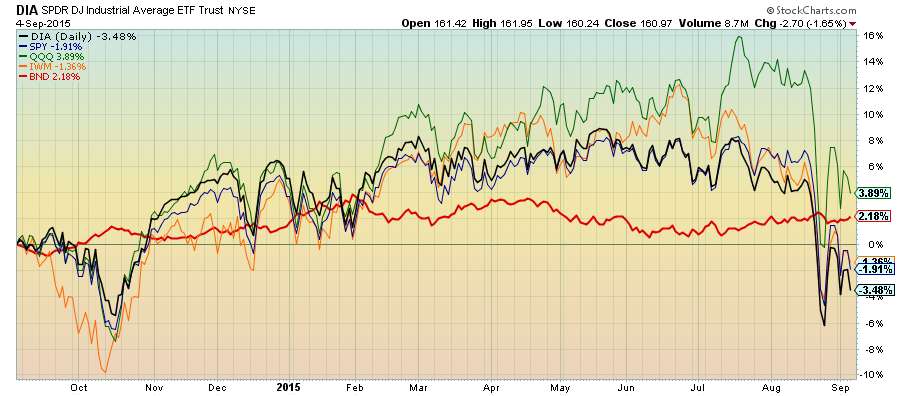

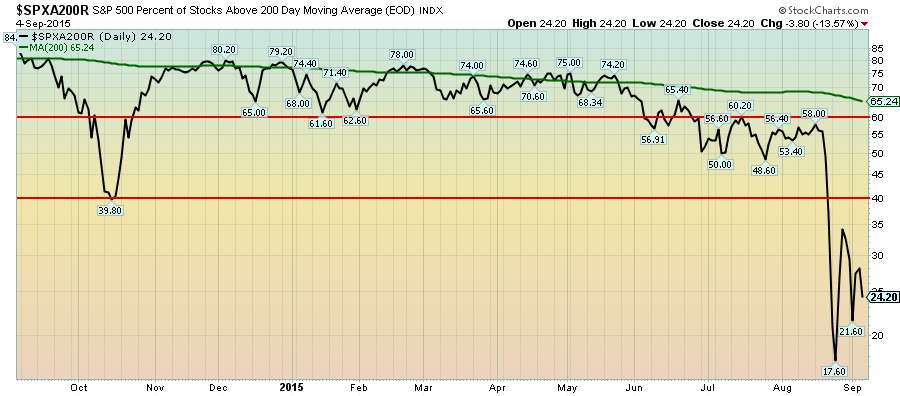
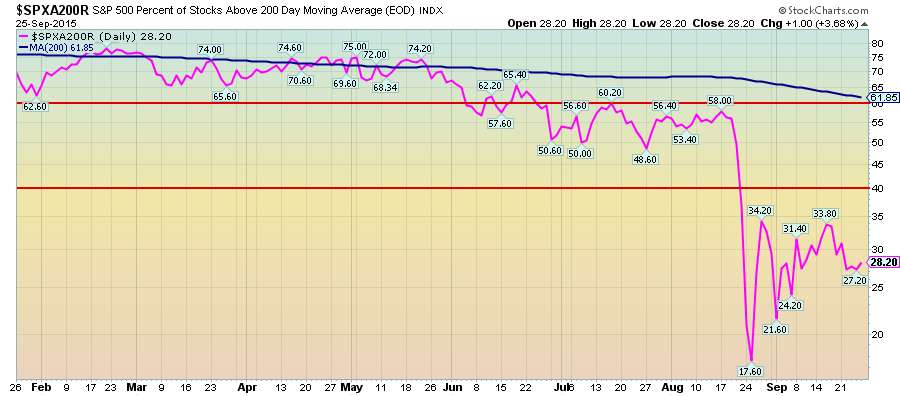
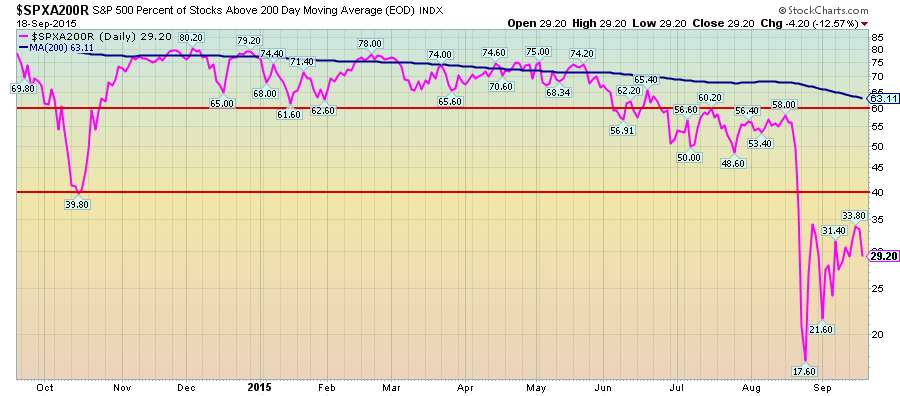
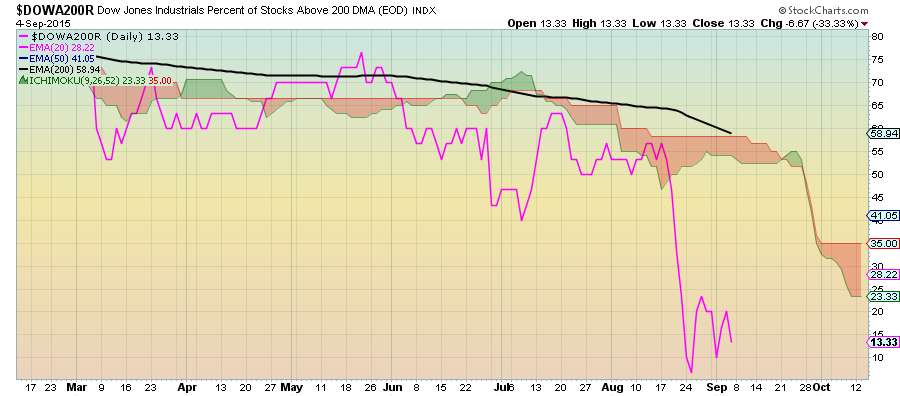
More than 75% of S&P 500 stocks are below their 200 Day Moving Average
- 8 point increase from last week