Tuesday, June 30, 2015

Just for $TWTR fans: $TWTR surges almost 6% ($2) so that those who bought at $52 are only sitting on a 30% loss

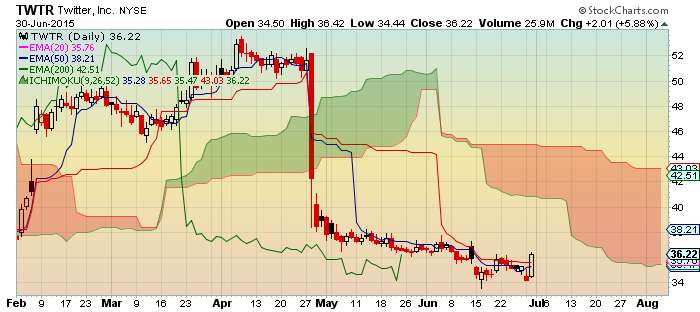
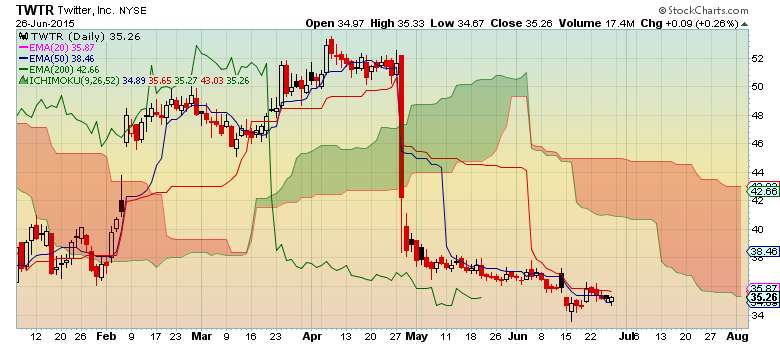
  • For investors: $TWTR faces major upside resistance.  Don't touch it unless it fits into your trading plan or unless you see some upside momentum because there are better investments out there.
Visit StockCharts.com to see more great charts.

Monday, June 29, 2015

$VIX shoots up like a bottle rocket into a resistance zone $VIX $SPX $SPY

  • $VIX and the market as defined by $SPX and $SPY are negatively correlated
  • Visit StockCharts.com to see more great charts.

Trading Plan - Today's market drop reinforces why your trading plan is important $SPX $SPY $DJIA

  • Your trading plan should tell you what to do not only when the market is rising, but also when it drops
  • Remember that the market always goes down faster than it goes up
  • Your reaction to the market should be automatic
  • If you find yourself paralyzed not knowing what to do your trading is not working
  • If you find yourself thinking too much about your next move then you need a new trading plan
  • Here is an example of a trading plan rule:
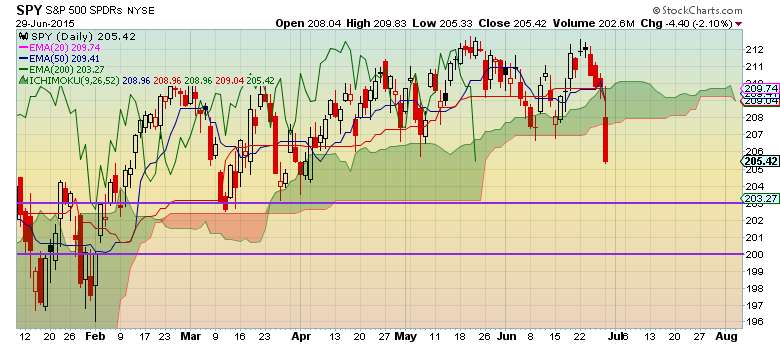
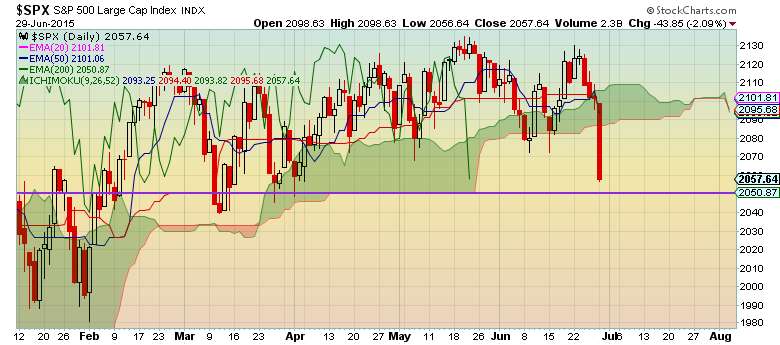
  •  Identify support and resistance levels.  Exit 50% of your positions if the market falls 1% below your 1st major support level.  Exit the remaining 50% if it falls 1% below your 2nd support level.
  • If you followed the above rules you would exit 1/2 of your positions at $201 and 1/2 at $198.
  • You should also have rules to tell you when to enter the market which could be the opposite of the above or whatever rules that work for you.
  • The above is just an example. Your trading plan and rules should fit your investment style and personality.
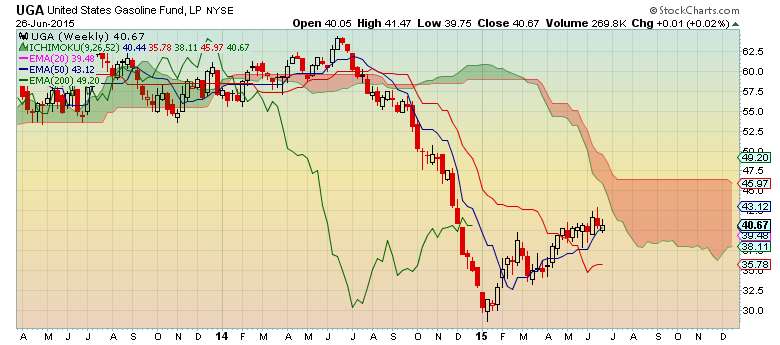
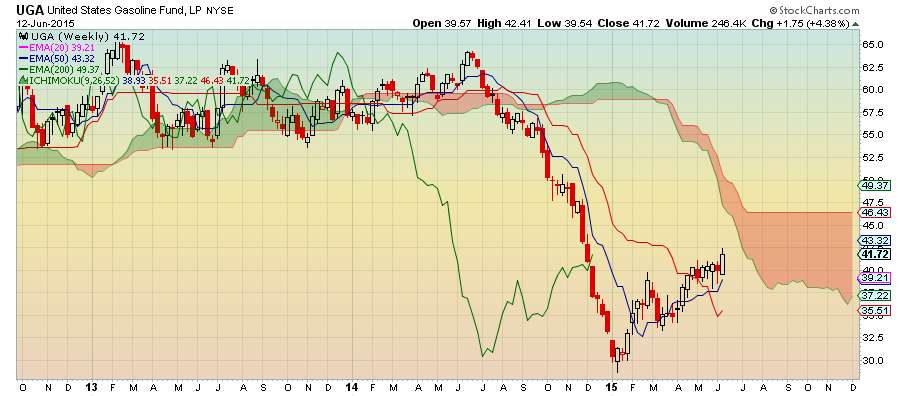
  • Happy Trading!


Visit StockCharts.com to see more great charts.

$SPX falls out of the cloud with major support looming and a break below it will be wearisome


Visit StockCharts.com to see more great charts.

Saturday, June 27, 2015

$UAL may be at a support level after falling over 20%


Visit StockCharts.com to see more great charts.

Dividend paying stocks like REITs and Utilities are declining due to rising bond yields


Visit StockCharts.com to see more great charts.

$AAPL is trading sideways in a support zone

  • Future cloud is flat illustrating flat trading
  • $AAPL is bullish overall so this may be an opportunity to pick up some shares if it fits your trading plan
Visit StockCharts.com to see more great charts.

$TWTR has been inching downward, but may have support around $34

  • Thick future bearish cloud implies very little upside in the near term
Visit StockCharts.com to see more great charts.

$BABA falls below support and the cloud and faces major resistance

  • Sentiment is bearish
  • Major resistance around $86.41 and $92.50
Visit StockCharts.com to see more great charts.

Oil is trading sideways with a future bearish cloud

  • Thick future bearish cloud implies that there may not be a lot of upside in the near-term
Visit StockCharts.com to see more great charts.

$VIX is right at an initial resistance level with a thinning future Kumo

  • 200-day EMA is the next level of resistance
  • A cross of the 200-day may lead to a decline in stocks
  • Investors should be watchful of their portfolios and be prepared to adjust if necessary
Visit StockCharts.com to see more great charts.

Divergent performance of $DJT weighs on $DJIA


Visit StockCharts.com to see more great charts.

$UGA is bearish with a think future Kumo waiting indicating resistance


Visit StockCharts.com to see more great charts.

$XLF in support zone which may be a buying opportunity since overall trend is bullish


Visit StockCharts.com to see more great charts.

$VNQ reaches support zone


  • That's the only compelling reason to buy if you must have real estate in your portfolio
  • The overall trend for $VNQ is still bearish


Visit StockCharts.com to see more great charts.

$IWM reaches support zone after 3 black crows


  • Although 3 black crows are a bearish candlestick patter, the overall trend for $IWM is bullish
  • Aggressive Investors can treat this as a dip and scale in when price is in the support zone
  • Nimble investors should wait until a bounce off support to ensure 3 black crows are not a trend reversal


Visit StockCharts.com to see more great charts.

Sunday, June 21, 2015

$RVX indicates $RUT and $IWM may have peaked


Visit StockCharts.com to see more great charts.

$VIX may be setting up to rise since future Kumo is thinning

This is bearish for the market.

Visit StockCharts.com to see more great charts.

$QQQ is bumping up against resistance

Investors should protect gains by tightening stops.
Visit StockCharts.com to see more great charts.

$IWM may have reached resistance at 128 and could be overbought

  • Investors would wise to tighten stops in case of a pullback
  • Investors waiting to jump on can target a price below 127 while keeping initial support in mind which is around 126
Visit StockCharts.com to see more great charts.

Let's see if the $DJIA bounces off support around 18,000 next week


Visit StockCharts.com to see more great charts.

$XLF pulls back in a bullish uptrend


Visit StockCharts.com to see more great charts.

$XLK pulls back to support, but overall trend is bullish


Visit StockCharts.com to see more great charts.

$XLP breaks above the cloud, but future Kumo is bearish

Caution is advised.

Visit StockCharts.com to see more great charts.

$XLE is at support and offers a potential counter trend trade


  • This could be a potential counter trend trade with resistance at 78
  • With a stop at 75.33 it has a potential 1-to-3 risk/reward ratio

  • Visit StockCharts.com to see more great charts.

$XLI has been in a consolidation trend since November


Visit StockCharts.com to see more great charts.

$XLY reached some resistance right below 78


Visit StockCharts.com to see more great charts.

$XLU bumped up against resistance and may be moving downward toward support


Visit StockCharts.com to see more great charts.

$XLV is bullish so wait for a pullback to enter


Visit StockCharts.com to see more great charts.

$XLB is trendless

  • Trading within the cloud
  • Very tight support and resistance

Visit StockCharts.com to see more great charts.

Saturday, June 20, 2015

$BABA is at a support level and could bounce, but keep expectations low

There are better opportunities out there and there is strong resistant at $92.50.

Visit StockCharts.com to see more great charts.

$VNQ is near resistance and may be a good short opportunity

  • With the Fed raising interest rates albeit gradually $VNQ is bearish
  • With $VNQ near resistance the rally may be short-lived creating a shorting opportunity
  • Stop loss at 79.61 results in a risk/reward ratio of 1-to-2.15
Visit StockCharts.com to see more great charts.

Year-to-date performance of major airlines $DAL $LUV $AAL $ALK $UAL


Visit StockCharts.com to see more great charts.

$LUV turns up and has a potential of a 1-to-3 risk/reward ratio

  • Airlines are turning up and $LUV is no exception
  • Price is currently at around major support at $34
  • Next resistance levels are at $36 and $38
  • A risk/reward ratio of 1-to-3 at the current price of $34.22 equates to a stop at $33.63 and target at $35.99
  • A trailing stop can be used also

Visit StockCharts.com to see more great charts.

$DAL gaps up from major support to the next support/resistance level

  • Traded around major support at $40.39 for 9 bars
  • Gaps to $41.99 which was resistance and is now support
  • Next resistance level is $43.47
  • A 1-to-3 risk reward ratio exists at the current price of $41.99, stop loss at $41.49, and profit target at $43.47
  • The stop is tight since $DAL is below the cloud
  • A trailing stop at $0.49 can be used to ride the upward trend
Visit StockCharts.com to see more great charts.

Airlines may be getting ready to bounce up

Airline index is at support which seems to be strong around $217.


Visit StockCharts.com to see more great charts.

SPY Ichimoku Cloud Multi-Timeframe Analysis