ACD Financial
@acdfinancial on Twitter
Saturday, March 12, 2016
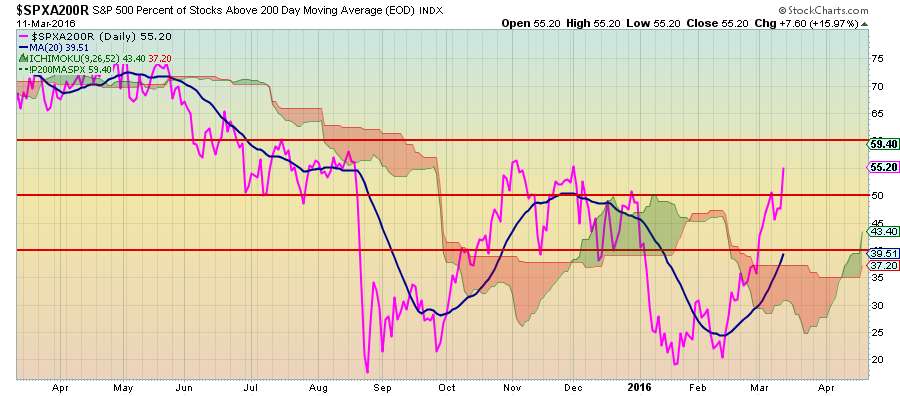
S&P 500 percent of stocks above 200-day average is above 55%
Check out this chart from
StockCharts.com
for $SPXA200R
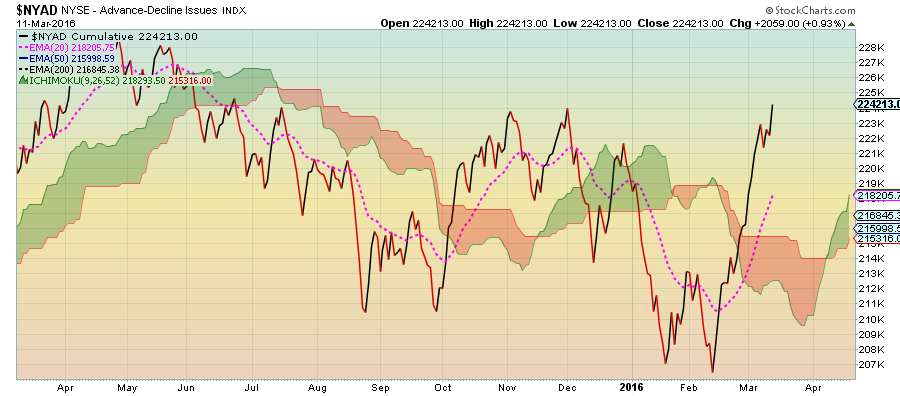
$NYSE Advance/Decline Breadth Line is in bullish territory above the cloud
Newer Posts
Older Posts
Home
Subscribe to:
Posts (Atom)