Sunday, May 31, 2015
Saturday, May 30, 2015
$VNQ - It's time to sell
Monthly Chart
Conclusion: Investors should sell $VNQ or at least reduce exposure and invest in a higher performing asset.
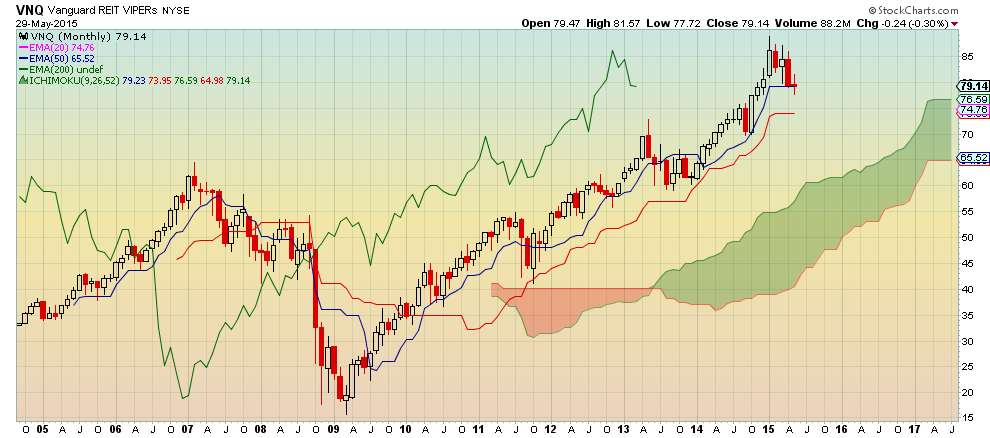
- Although $VNQ is bullish it's relative strength and upward momentum has slowed
- $VNQ is -1.71% year-to-date vs. +3.23% for $VOO (S&P 500)
- 1-year performance is +10.79% vs. +12.58% for $VOO
- Price has closed below Tenkan Sen (blue line) which represents the average of the high and low price over 9 months
- Both Tenkan Sen and Kijun Sen (red line) are flat implying no upward momentum
- Leading Kumo is slanted horizontally confirming flat momentum
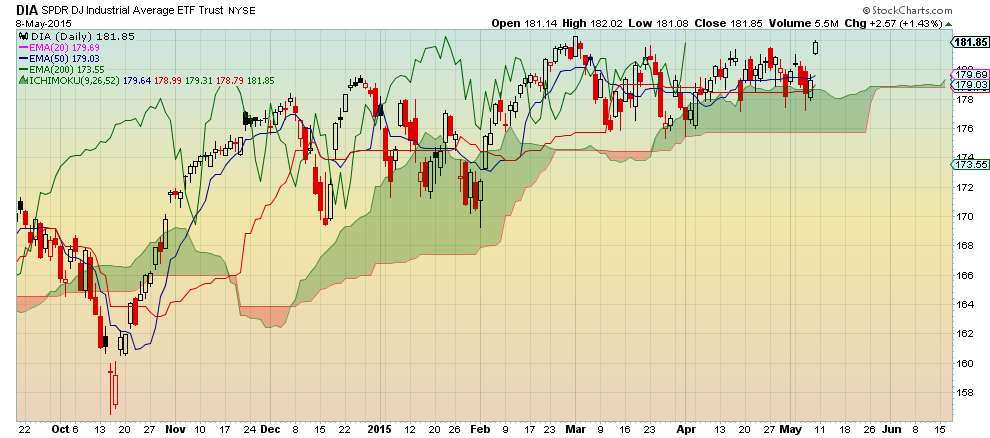
$DJT to $DJIA ratio is bearish
Weekly Chart
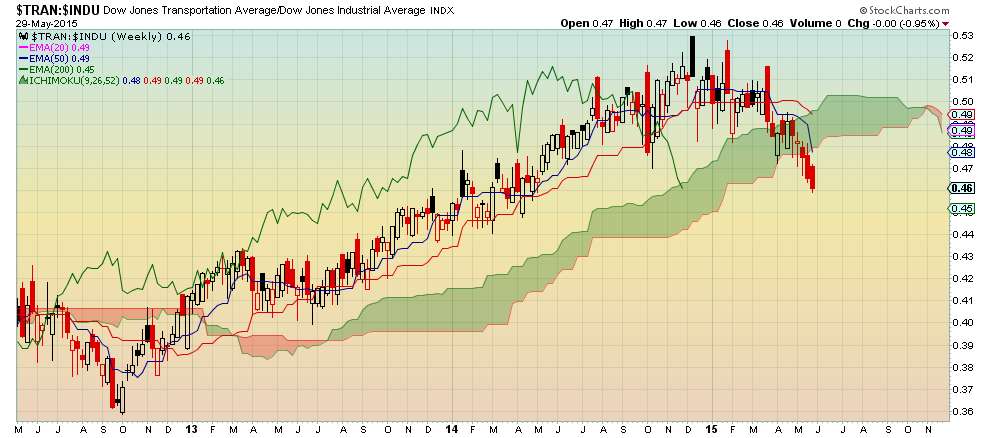
- The $DJT to $DJIA ratio is bearish as all Ichimoku Cloud elements are properly aligned for a bearish sentiment
- $DJT divergence to $DJIA is a concern as transportation stocks can be a leading performance indicator
Friday, May 29, 2015
$QQQ is bullish
Daily Chart
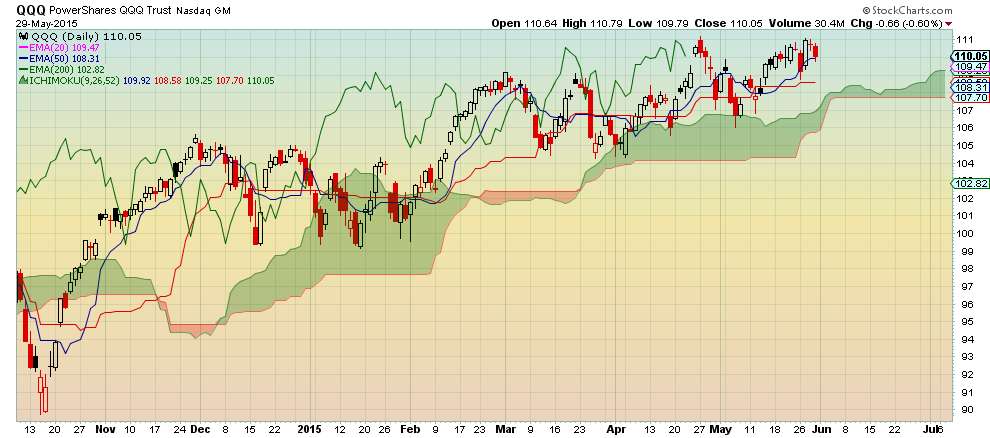
- $QQQ is bullish as all Ichimiku Cloud elements are properly aligned.
- Price is above the cloud and above both Tenkan Sen (blue line) and Kijun Sen (red line) - bullish
- Tenkan Sen is above Kijun Sen and slanted upward which favors short-term momentum- bullish
- Chikou Span is above the price curve 26 days ago - bullish
- Kumo (cloud) is green - bullish
- The last bullish signal issued was on May 19 as Tenkan Sen crossed above Kijun Sen
Conclusion: Investors should look for an entry point on a pullback or on a lower timeframe (i.e hourly chart, etc.) by scaling in.
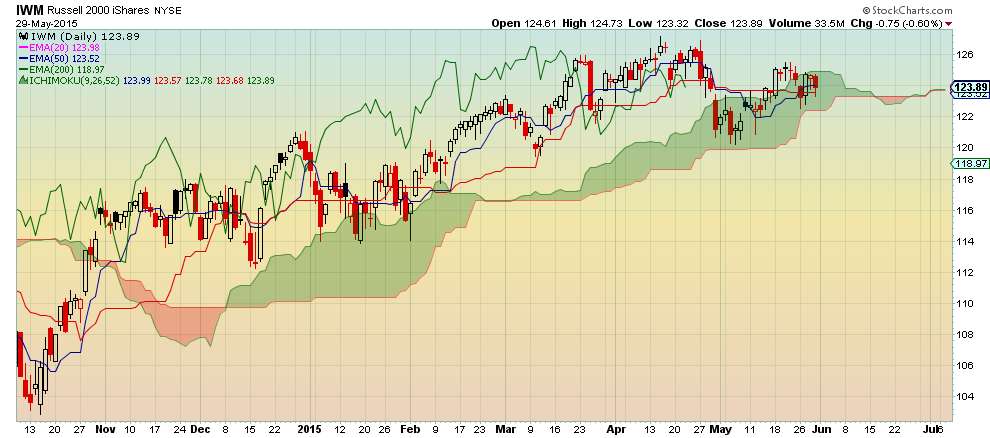
$IWM is in the cloud which shows indecision about direction
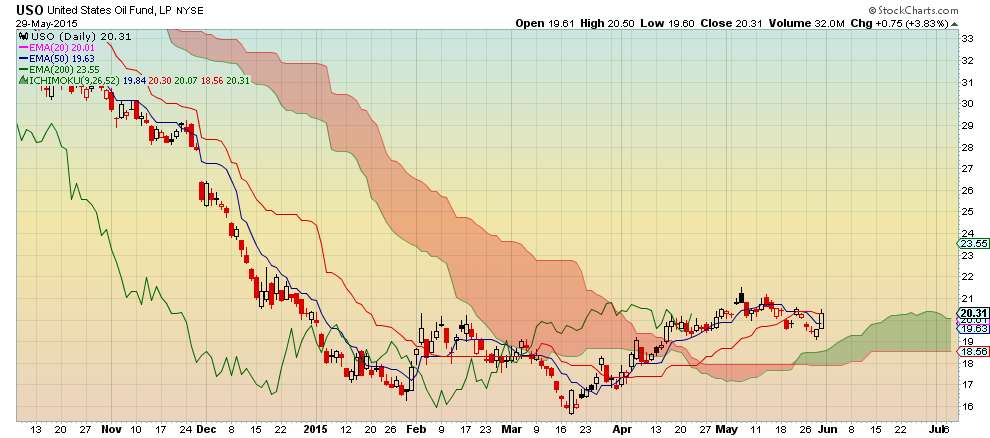
$USO issues bullish signal, but caution is advised
- Price is above the cloud and crossed above Kijun Sen which is bullish
- Tenkan Sen is below Kijun Sen and investors would be wise to wait until it crosses above it
- Leading Kumo is horizontal which suggests sideways trading
Tuesday, May 26, 2015
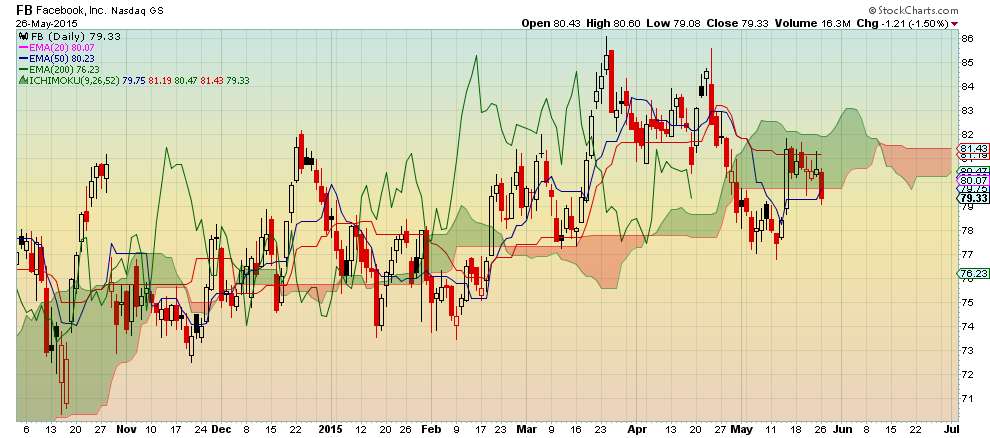
$FB may be a buying opportunity
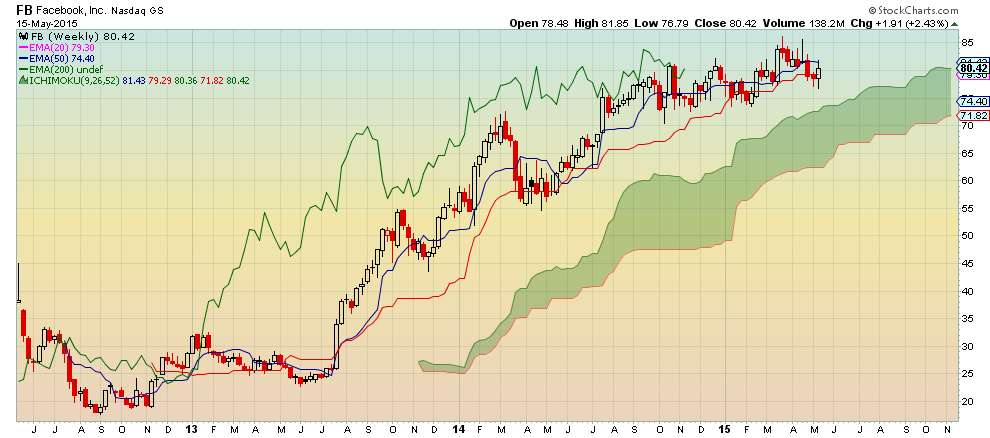
Weekly chart confirms bullish state with daily chart supporting probability of a pullback within an uptrend. This may be a buying opportunity for investors that like $FB.
Weekly Chart
Weekly Chart
- $FB is still bullish on weekly chart despite price crossing below Kijun Sen
- Tenkan Sen (blue line) remains above Kijun Sen (red line) which is bullish for momentum
- Chikou Span (green line lagging 26 periods) is above the price curve - bullish
- Leading Kumo (cloud) is green - bullish

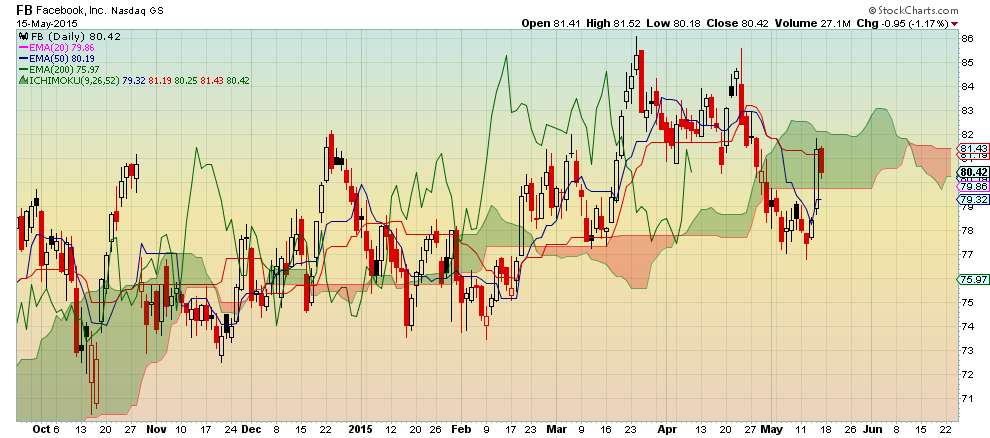
- $FB turned bearish on daily chart at the beginning of May with price crossing Kijun Sen and later confirmed by crossing below the Kumo
- Chikou Span confirmed bearishness as it crossed below the price curve
- Support seems to be around $78 before price entered back in the cloud and then closed below it
- With price showing support it may be a buying opportunity in an uptrend
$UNG remains bearish despite a slight uptrend for a couple of weeks
Weekly Chart
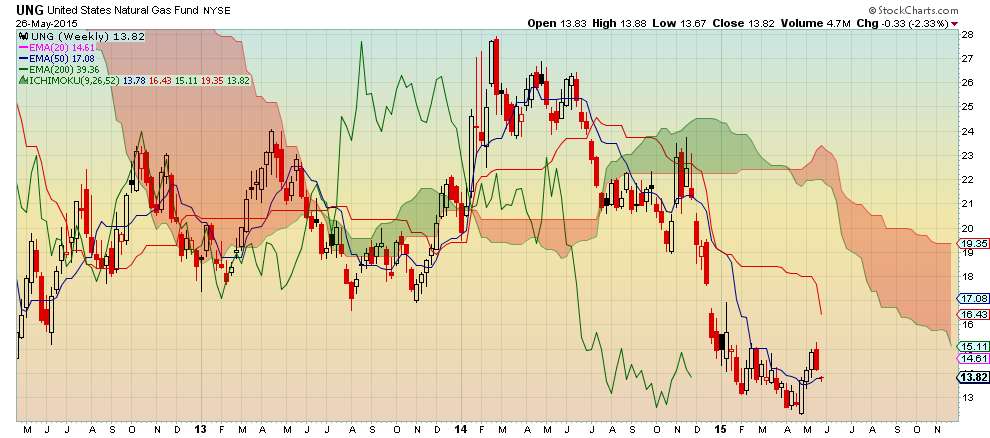
- The price curve has been below the Kumo since August 2014 which is bearish
- Tenkan Sen has been below Kijun Sen and crossed below it back in July 2014
- The recent rally above Tenkan Sen may be an opportunity to short the ETF for a quick short-term, but limited gain
$PG turns bearish on weekly chart
Weekly Chart
- Price crosses below Kumo which is bearish
- Leading Kumo has turned red
- Tenkan Sen is below Kijun Sen and crossed below it back in March although the cross occurred above the cloud
- Chikou Span and Tenkan Sen are pointing downward which confirms bearish state
e
Monday, May 25, 2015
$SPY Momentum is slowing
Daily Chart
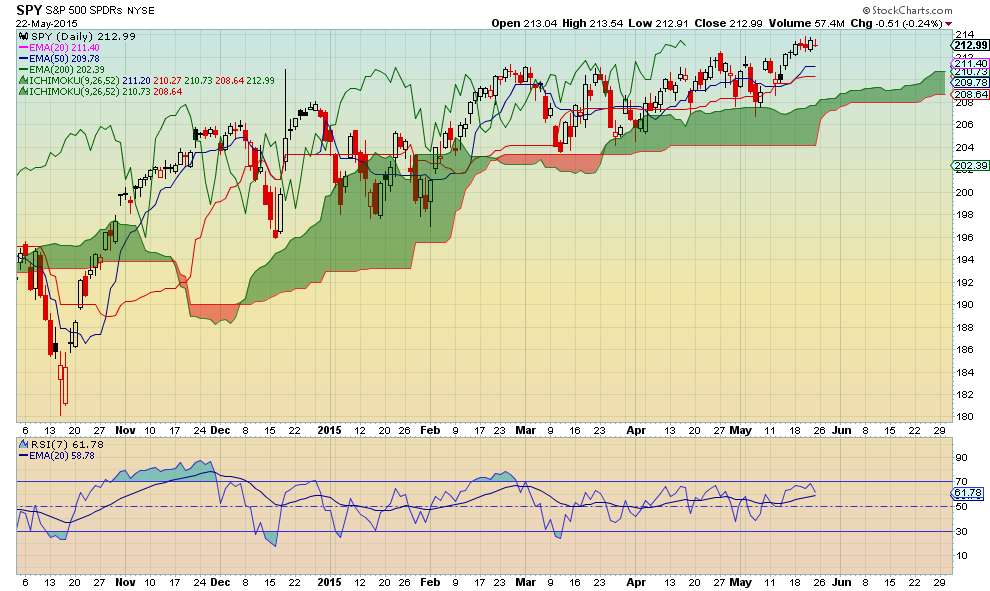
- Price may have peaked
- Tenkan Sen (blue line) and Kijun Sen(red line) are flattening which implies that momentum is slowing
- RSI is declining supporting momentum change
- Leading Kumo is slanting sideways confirming that upward momentum has slowed
- Please note that SPY is still bullish until it turns bearish
Friday, May 22, 2015
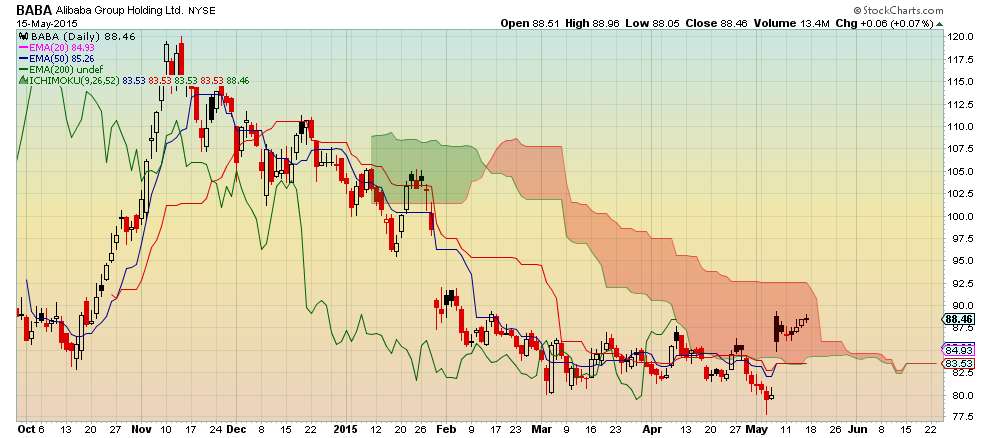
$BABA turns bullish with exit above the Kumo
Daily Chart
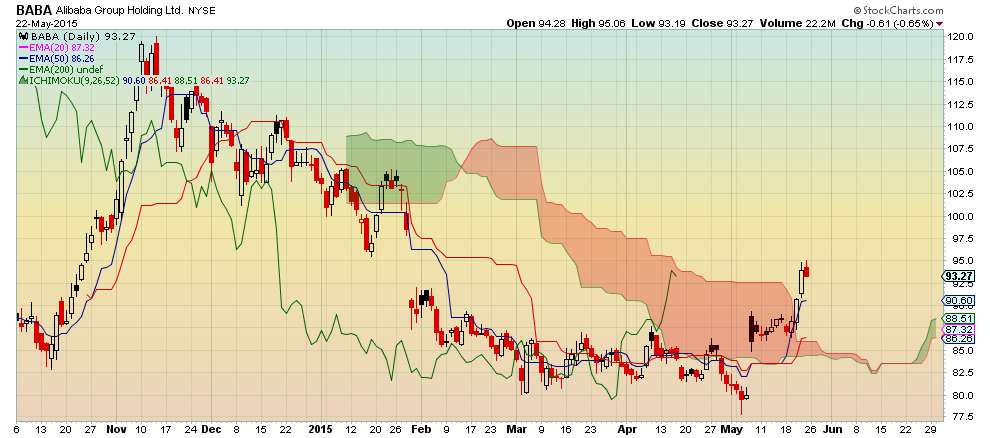
- $BABA exited the cloud which is bullish
- Leading Kumo is green which is bullish
- Tenkan Sen (blue line) and Kijun Sen (red line) are above the cloud which is bullish
- Candle crossed $92.50 which was major resistance and may now become support
- $BABA may consolidate around $92.50 as traders digest the upward movement
- Chikou Span (26 day lagging green line) is above the price which is bullish
- Since Chikou Span is still in the cloud investors should be cautious
- Thin Kumo also supports caution
- Investors should scale in if $BABA fits into their investment strategy
Sunday, May 17, 2015
$FB is currently neutral
Weekly Chart
 Daily Chart
 Conclusion
$FB is neutral at the moment. Price needs to close above the cloud for it to exhibit upward momentum. Nimble investors should be patient until weekly chart shows that price is above Tenkan Sen before investing. Aggressive investors can scale in and treat the current environment as a pullback in an uptrend and use stops
- $FB is bullish overall since price is above the Kumo (cloud)
- Turned bearish when price closed below Kijun Sen and turned bullish again when price closed above Kijun Sen
- Tenkan Sen and Kijun Sen are flattening which suggests sideways trading
Daily Chart- $FB turned bearish after crossing below the Kumo (cloud) at the end of April
- Price has moved into the cloud which represents stasis
- Leading Kumo is red which is bearish
- Price needs to close above the cloud to exhibit upward momentum
Conclusion$FB is neutral at the moment. Price needs to close above the cloud for it to exhibit upward momentum. Nimble investors should be patient until weekly chart shows that price is above Tenkan Sen before investing. Aggressive investors can scale in and treat the current environment as a pullback in an uptrend and use stops
$TWTR homes in around $37-$38
Daily Chart - Ichimoku Cloud Analysis
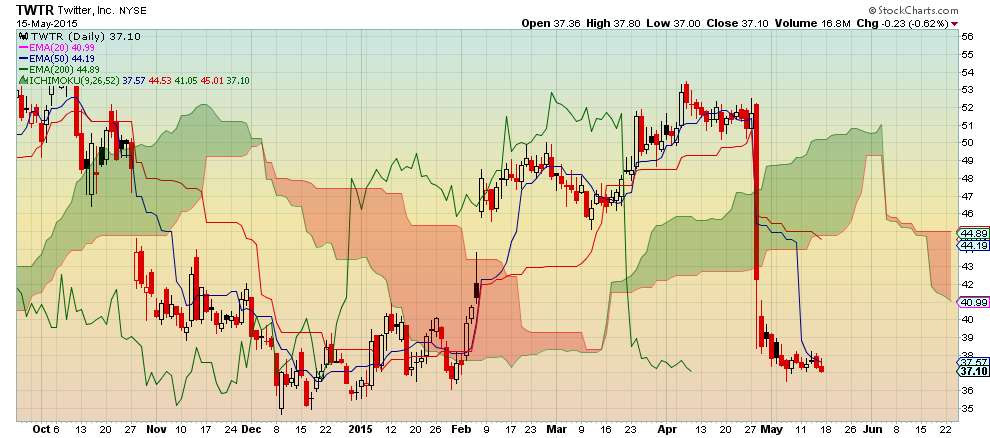
- $TWTR seems to have found a home around $37-$38
- $TWTR is bearish since it trades below the Kumo (cloud)
- Tenkan Sen is pointing downward, but will flatten showing no price momentum
- Kijun Sen has crossed below the cloud adding to bearish confirmation
$BABA still has not cleared $92.50
Daily Chart
- $BABA still trades in the Kumo (cloud) despite gapping up 7 days ago for a weak Ichimoku Cloud bullish signal
- Leading Kumo is so thin due to flat trading before the gap up that $BABA may trade above it
- Resistance will remain at $92.50 until price crosses it
- Due to Ichimoku Cloud elements being all at $83.53 which represents price equilibrium, investors shouldn't be surprised if $BABA touches near it again
1-year performance of major airlines $LUV leads while $DAL is the laggard
$DJUSAR $DAL $AAL $LUV $UAL $ALK
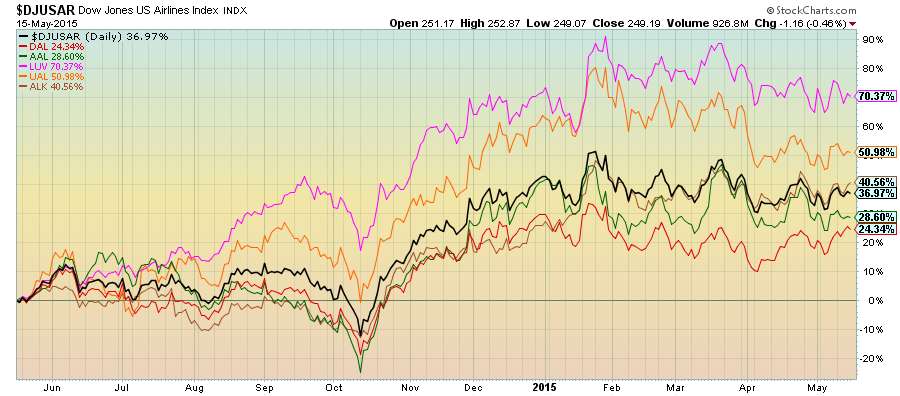
- $LUV leads the pack as usual with $DAL bringing up the rear
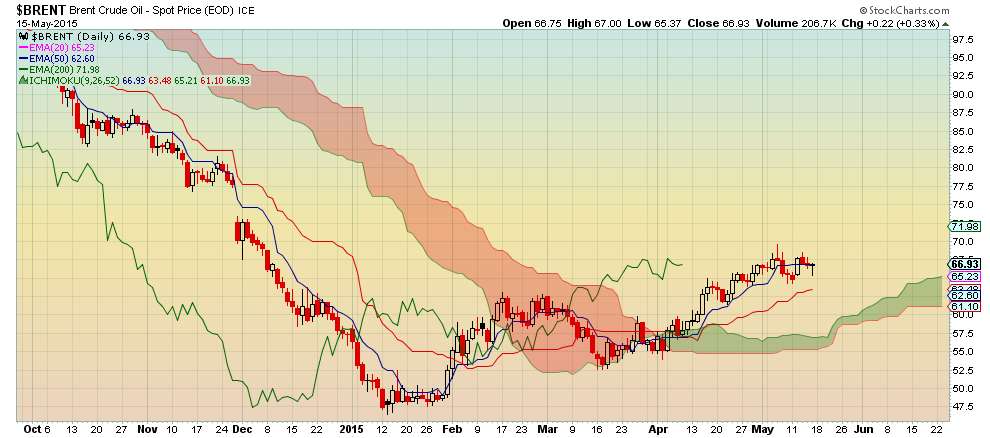
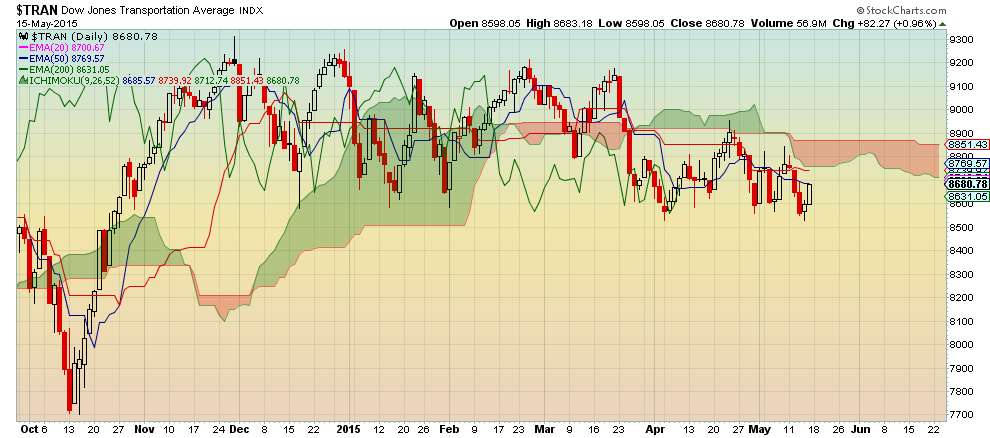
Oil prices weigh on transportation stocks
$BRENT $TRAN
Daily Chart
 Transportation stocks are bearish as the index has traded below the Kumo (cloud) since the end of March
Daily Chart
- Oil prices turned bullish in mid-April as price/barrel rose into the mid-60s
- The increase in price has weighed on transportation stocks
Transportation stocks are bearish as the index has traded below the Kumo (cloud) since the end of March
U.S. Airlines Index is bearish as it trades below the Kumo (cloud)
$DJUSAR
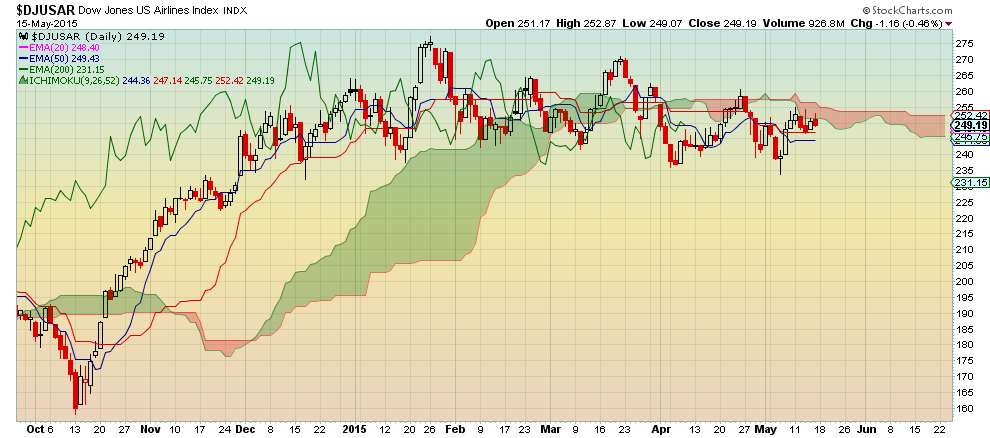
Daily Chart
- U.S. Airlines Index turned bearish in April although trading has been choppy all year
- Kijun Sen seems to be offering support around 247 and is flat
- Tenkan Sen is below Kijun Sen and is flat which shows no momentum
- Leading Kumo is red which is bearish
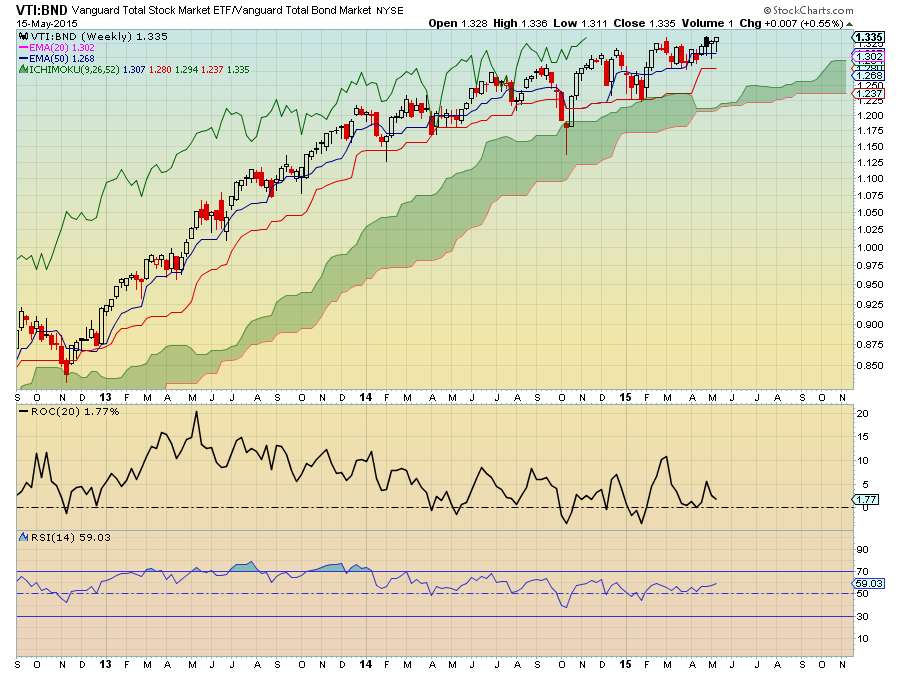
Stock-to-Bond Ratio favors stocks
$VTI $BND
- Ratio is above the Kumo and all Ichimoku Cloud elements are properly aligned
- The ratio is currently bullish for stocks
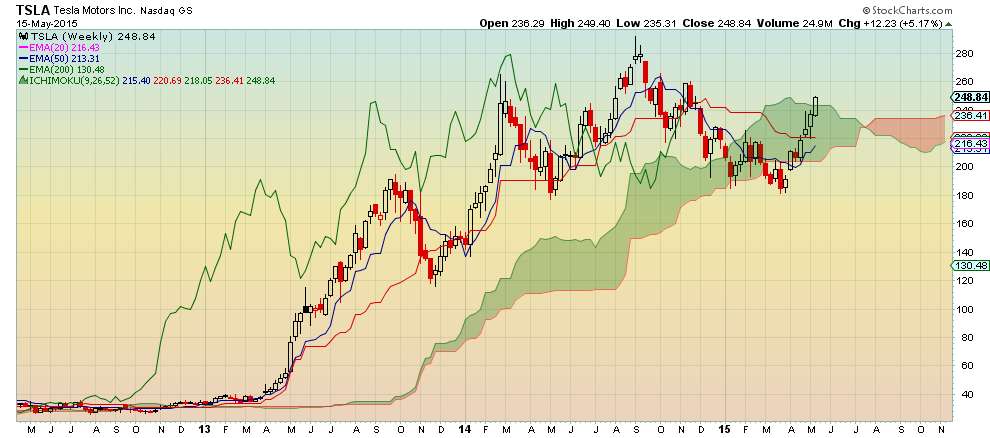
$TSLA issues Ichimoku Cloud bullish signal on weekly chart
$TSLA issued an Ichimoku Cloud bullish signal on April 22 on the daily chart as it broke above the Kumo. It is up over 10% since the signal. The weekly chart has turned bullish too.
Weekly Chart
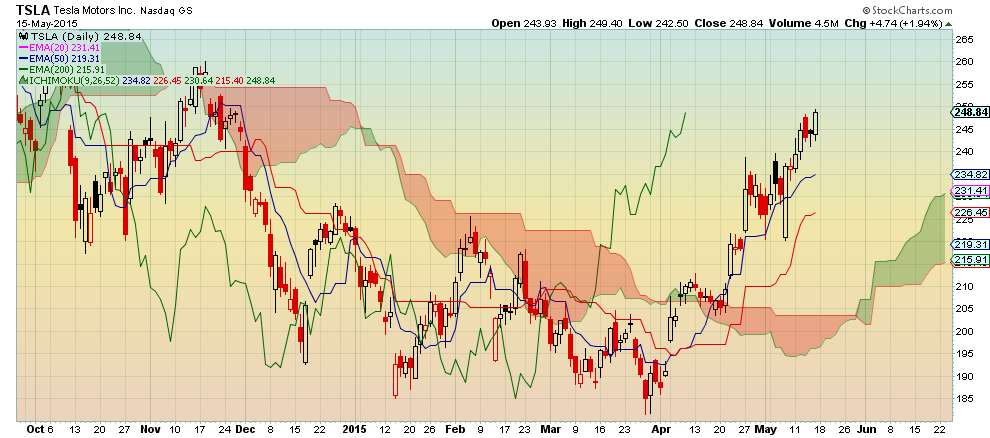
 Daily Chart
Conclusion
Weekly Chart
- $TSLA breaks above Kumo which is bullish adding more confirmation to the April 22 bullish signal
Daily Chart- Ichimoku Cloud bullish signal issued on April 22 as $TSLA broke above the Kumo
- $TSLA is up over 10% since the signal was issued
Conclusion
- All signs are bullish. Investors that missed out on the May 2 signal should be patient and wait for a pullback and scale in on the daily chart. Alternatively, analyze and utilize a lower timeframe chart (i.e hourly chart) to scale in.
Saturday, May 16, 2015

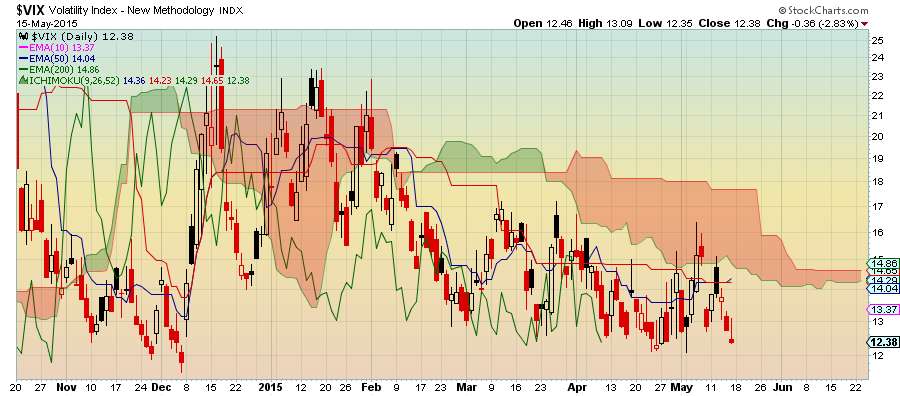
$VIX supports bullish market, but investors should be cautious and protect portfolios
Daily Chart
 Conclusion
$VIX supports a bullish market, but investors should be cautious as the potential for a pullback is high.
Conclusion
$VIX supports a bullish market, but investors should be cautious as the potential for a pullback is high.
- $VIX is bearish since price is below the Kumo (cloud)
- Thickness of Kumo shows resistance
- Leading flat top/belly down Kumo has the potential to attract price, but Senkou Span B offers resistance
Conclusion
$VIX supports a bullish market, but investors should be cautious as the potential for a pullback is high.
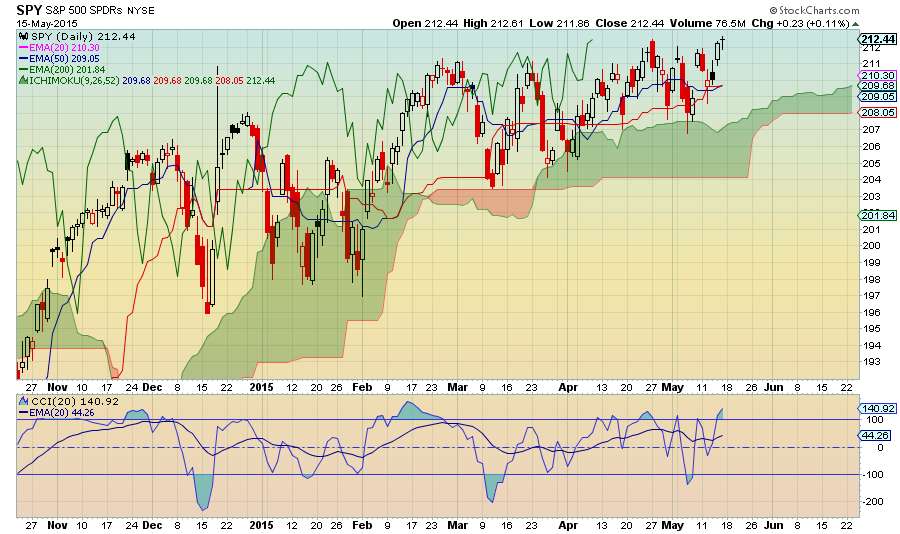
$SPY may be overbought and subject to a pullback
Daily Chart
- Ichimoku Cloud bullish signal with Tenkan Sen (blue line) rising to equal Kijun Sen (red line)
- Cross reveals price equilibrium for Tenkan Sen, Kijun Sen, and Senkou Span A since all equal 209.68.
- Equilibrium indicates the potential for a pullback
- Dojo reveals indecision at the current price level which suggests investors should be cautious
- CCI indicator reveals that $SPY is overbought supporting the potential for a pullback.
Sunday, May 10, 2015
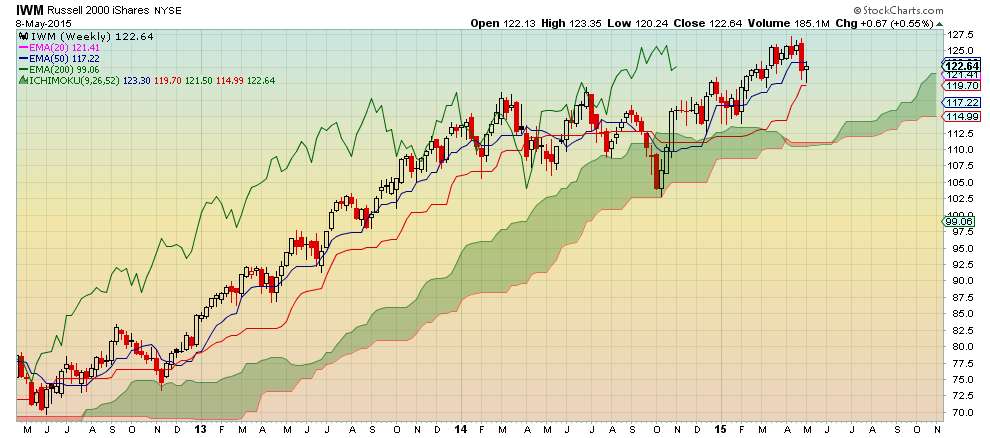
$IWM is in the Kumo on daily chart indicating indecision about direction
Always start with a higher timeframe before evaluating a trade in your trading timeframe. Since our trading timeframe is daily our higher timeframe is weekly.
Weekly Chart
 Daily Chart
 Conclusion
Weekly Chart
- $IWM is bullish since price is above the Kumo
- Red Kumo below price is thin indicating indecision, but overall Kumo is green and is slanted upwards
- Kijun Sen seems to be providing support which is around 120
Daily Chart- $IWM is trading in the Kumo despite rising +0.75% on May 8 indicating indecision on direction
- Tenkan Sen is below Kijun Sen which shows the decline in short-term momentum
- Senkou Span A is below Senkou Span B which supports bearish short-term sentiment
Conclusion
This may be a buying opportunity for aggressive traders. Nimble traders should wait until price closes above the Kumo or until Tenkan Sen is above the Kumo before making a trade.
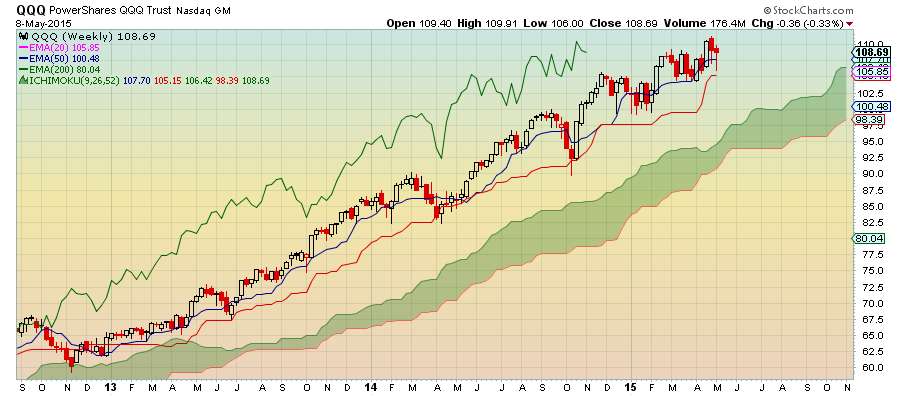
$QQQ issues bullish signal on daily chart
First, we always seek confirmation on a higher timeframe chart to improve the probability of a successful trade. We want to trade in the direction of the trend.
Weekly Chart
 Daily Chart
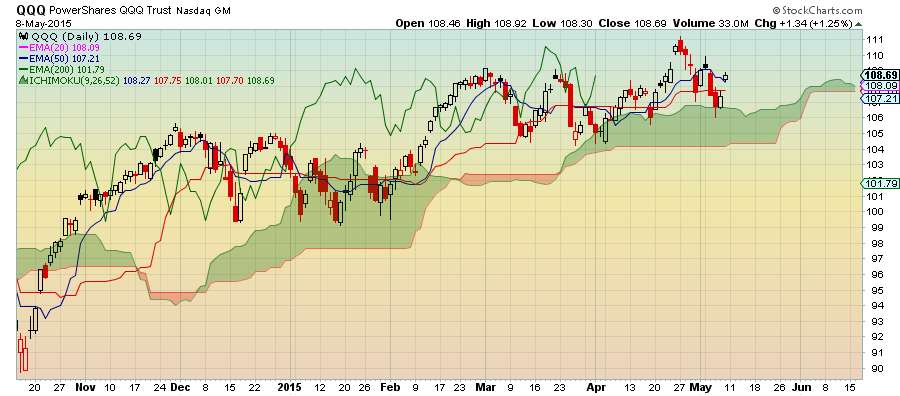
Weekly Chart
- $QQQ weekly chart is bullish as all Ichimoku Cloud elements are properly aligned
- Proper alignment on a higher timeframe chart increases the probability of a successful trade
Daily Chart- $QQQ issues bullish signal on May 8 as price closed above Kijun Sen
- The ETF experienced resistance around $108 so this may act as support
- Kumo offers additional support after priced bounced off of it a few days ago
- Chikou Span adds further bullish confirmation since it is above the price curve from 26 days ago
Saturday, May 9, 2015
$UNG may be a short opportunity given the recent bounce into the Ichimoku Cloud
Daily Chart
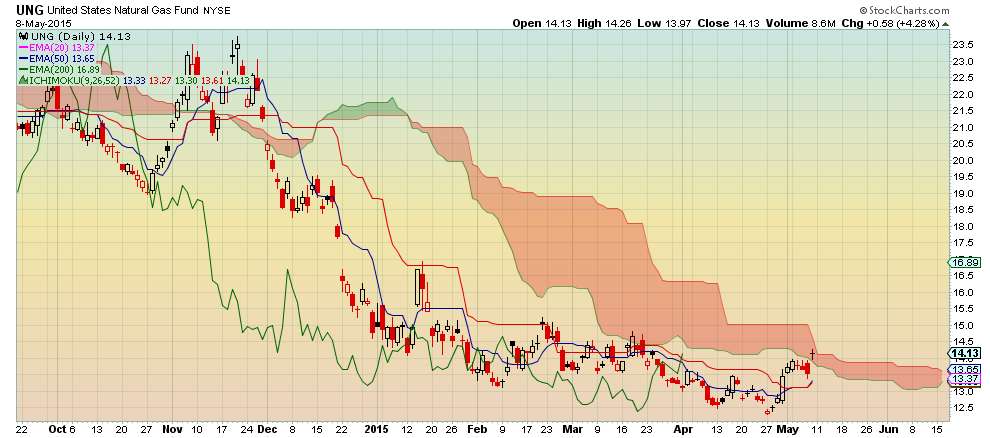
- The sentiment is bearish for $UNG which is confirmed by the weekly chart (see below)
- Bullish signal issued on May 4 as Tenkan Sen crossed Kijun Sen. Price crossed Kijun Sen on April 30 which was also bullish.
- The bullish signals are weak since they occurred below the cloud
- Counter trend traders have an opportunity to short $UNG
- This is a limited profit opportunity and a stop and profit target should be used with the strategy
Weekly Chart
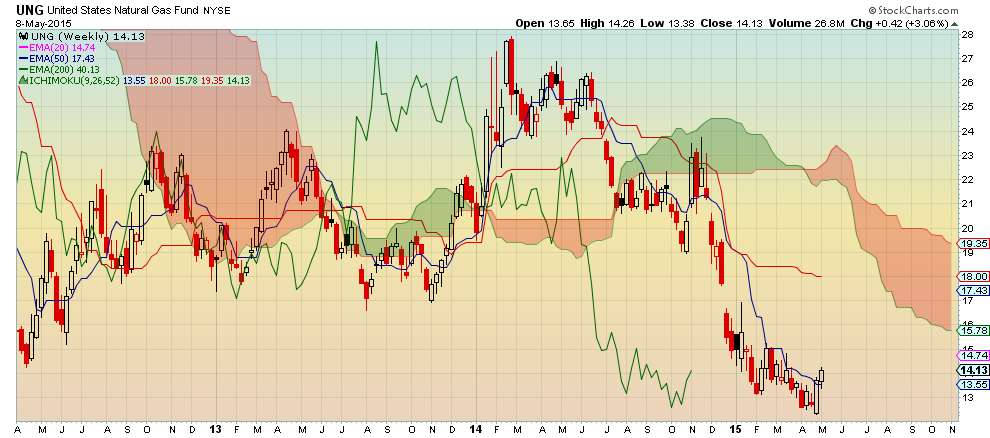
- $UNG has been in a bearish trend since last summer
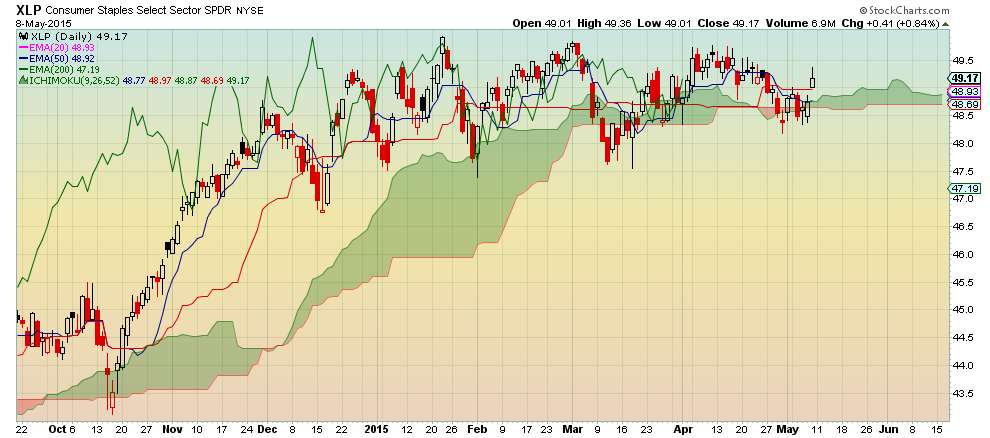
Consumer Staples ($XLP) issues Ichimoku Cloud bullish signal on daily chart
Daily Chart
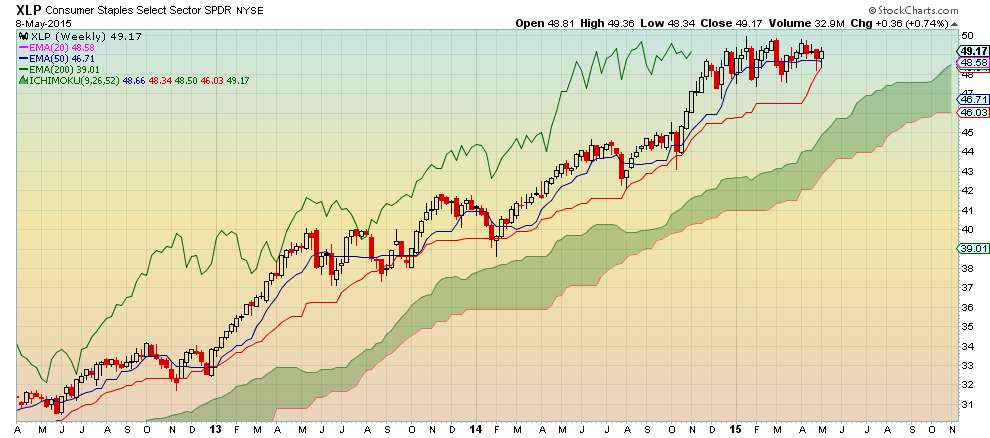
 Weekly Chart
- Bullish signal issued on daily chart as price closed above Kijun Sen (red line)
- Chikou Span (green line) confirms bullish signal with upward cross through price
- Weekly chart confirms bullish uptrend and ensures trade is with the trend (see weekly chart)
- Leading Kumo (cloud) is green, but is flat and reveals that trading has been choppy recently
- Investors would be wise to scale in since price may be attracted to Senkou Span B like a magnet
- Nimble traders can wait until Tenkan Sen crosses Kijun Sen for further confirmation that upward trend has resumed
Weekly Chart- Weekly chart is bullish since price is above the cloud, the cloud is green, and slanted upwards which confirms uptrend
- $XLP has traded in a range of $48-$50 since the beginning of the year
- Price has danced around Tenkan Sen (blue line) which is relatively flat indicating a pause in upward momentum
- Kijun Sen (red line) is rising which is bullish
Friday, May 8, 2015
Sunday, May 3, 2015
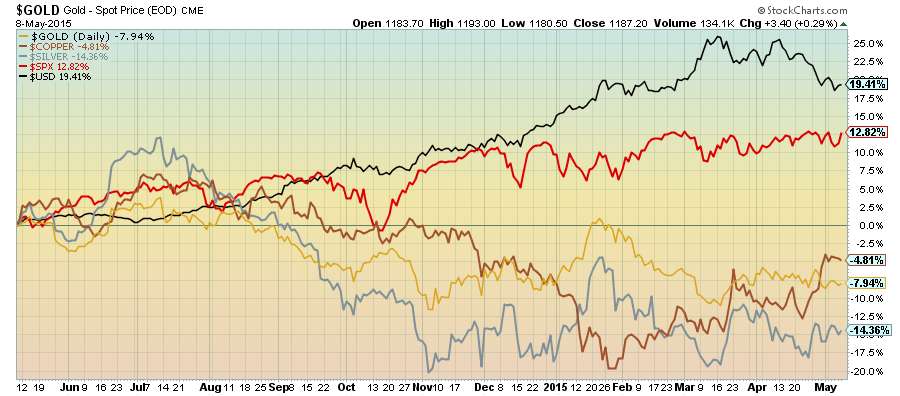
USA vs. World: USA Wins
1-Year Performance
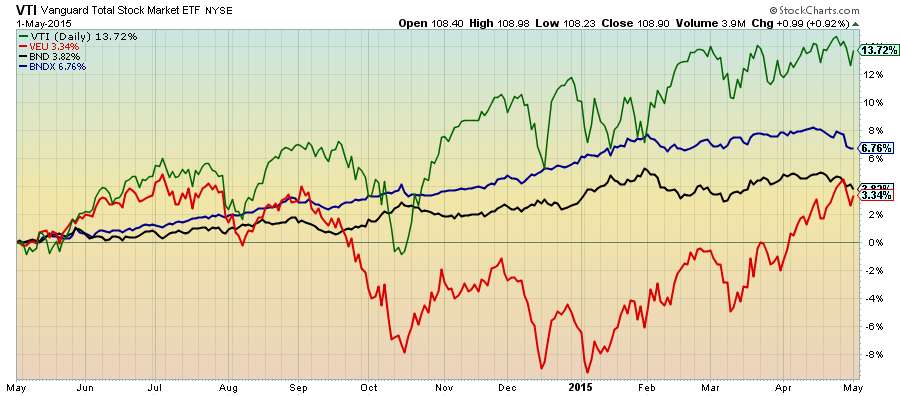
- $VTI - Vanguard Total U.S. Stock Market Index ETF is up 13.72%
- $VEU - Vanguard FTSE All-World Ex-US Index ETF is up 3.34%
- $BND - Vanguard Total U.S. Bond Market Index ETF is up 3.82%
- $BNDX - Vanguard International Bond Mark Index ETF is up 6.76%
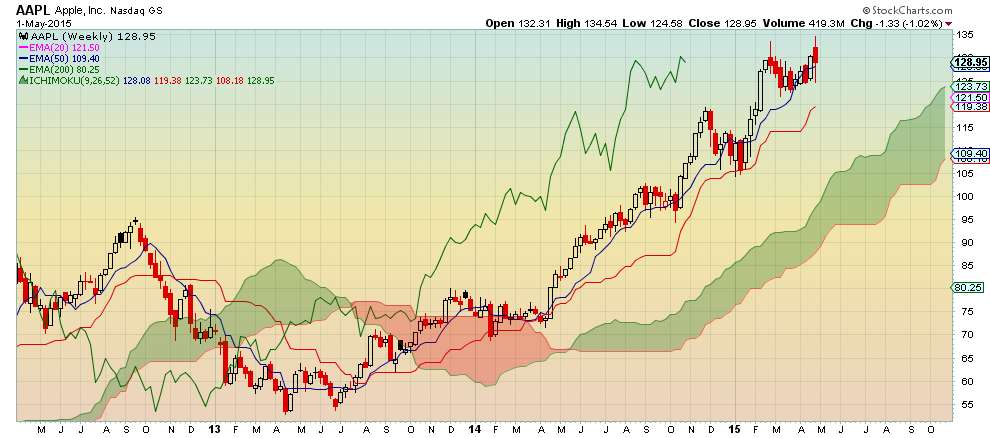
$AAPL Ichimoku Cloud Analysis
Weekly Chart
 Daily Chart
 Conclusion
Investors should seek an entry point to ride the bullish trend.
Conclusion
Investors should seek an entry point to ride the bullish trend.
- $AAPL is bullish as all Ichimoku Cloud elements are properly aligned
- Use Daily or Hourly Chart for an entry point.
Daily Chart- $AAPL is bullish. Ichimoku Cloud issued a bullish signal on May 1.
Conclusion
Investors should seek an entry point to ride the bullish trend.
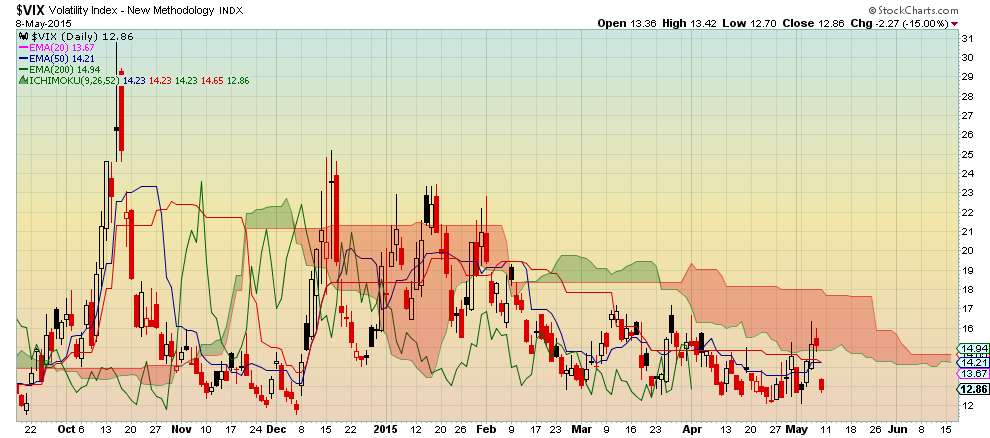
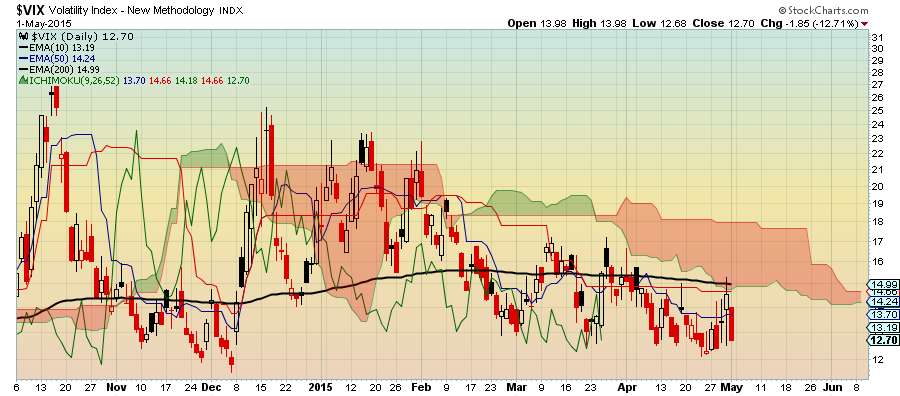
$VIX Ichimoku Cloud Analysis
Weekly Chart
 Daily Chart
 Conclusion
Investors should be cautious since the $VIX will spike at some point. Take some money off the table if you are a nimble investor and use it to buy dips and minor corrections. There is no shame in selling high and buying low.
Conclusion
Investors should be cautious since the $VIX will spike at some point. Take some money off the table if you are a nimble investor and use it to buy dips and minor corrections. There is no shame in selling high and buying low.
- $VIX is bearish (price is below the cloud, cloud is red although it briefly turned green, and Tenkan Sen is below Kijun Sen, Chenkou Span confirmation)
- $VIX being bearish with a red cloud supports the bull market in stocks
- Spikes into and above the cloud correspond with market pullbacks and choppy trading
Daily Chart- $VIX is bearish in daily chart and aligns with Weekly Chart (price is below the cloud and below 200 EMA, Tenkan Sen is below Kijun Sen, cloud is red, Chenkou Span bearish signal)
- This bodes well for the market since $VIX and the market are negatively correlated
- $VIX is mean reverting so $VIX at these price levels could be indicating a market top
- A spike above Kijun Sen and the 200 EMA will have a negative impact on stock prices
Conclusion
Investors should be cautious since the $VIX will spike at some point. Take some money off the table if you are a nimble investor and use it to buy dips and minor corrections. There is no shame in selling high and buying low.
Saturday, May 2, 2015
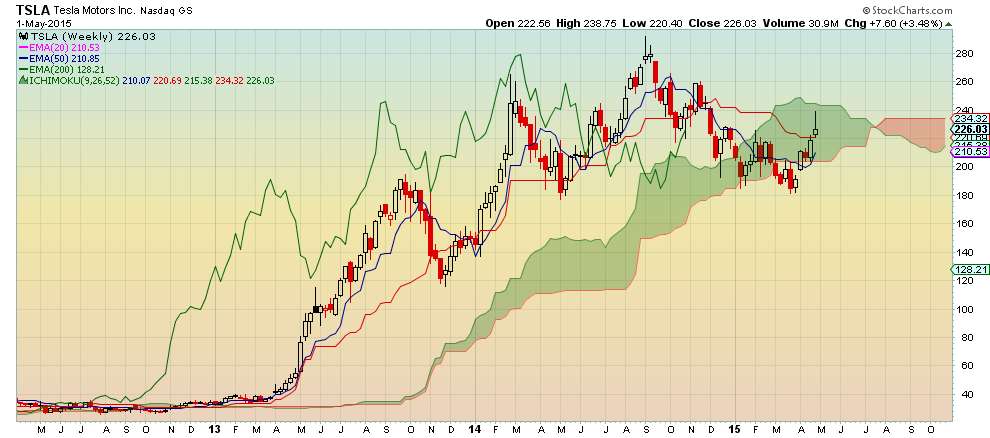
$TSLA Ichimoku Cloud Analysis
Weekly Chart
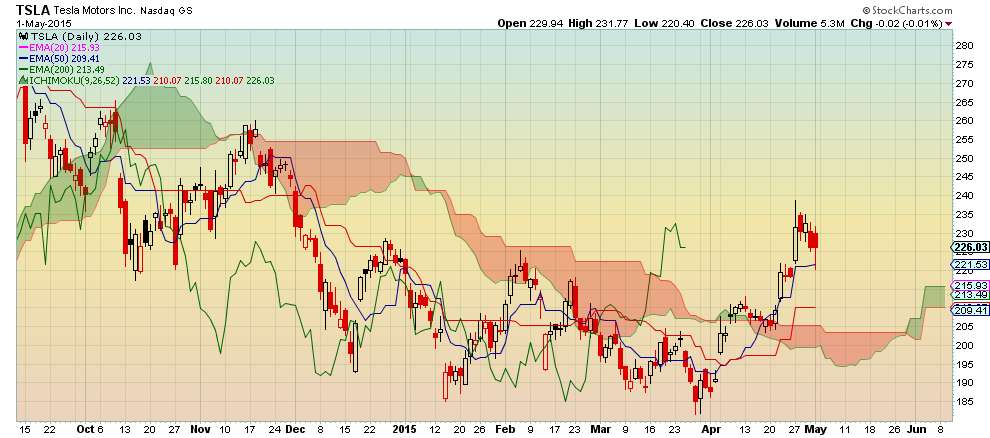
 Daily Chart
 Conclusion
Investors wishing to include $TSLA in their portfolio can scale in to manage risk.
- Price is showing upward momentum and a bullish signal was issued when price crossed Kijun Sen (red line)
- Bullish signal is neutral since signal occurred in the cloud
- Leading cloud is red (Senkou Span A is below Senkou Span B), but Senkou Span A is pointing upward and cloud will change to green if it crosses Senkou Span B
Daily Chart- $TSLA is now bullish on the daily chart after being bearish since October
- $TSLA's exit above the cloud turned overall sentiment to bullish
- Price is showing a slight pullback which may be a buying opportunity with Tenkan Sen pointing slightly upward while Kijun Sen is flat
- Leading cloud is green since Senkou Span A is above Senkou Span B
ConclusionInvestors wishing to include $TSLA in their portfolio can scale in to manage risk.
$VNQ Ichimoku Cloud sell signal if candle closes below Tenkan Sen on monthly chart
Monthly Chart
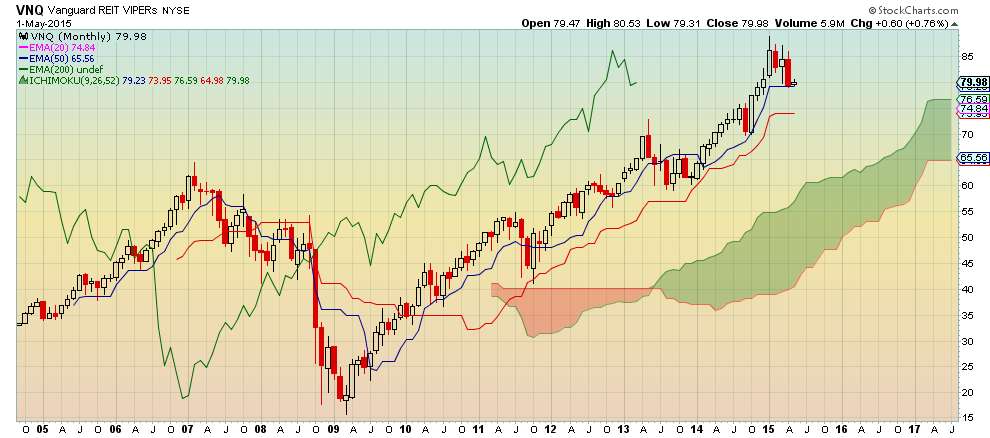
- Long-term trend is bullish as all Ichimoku Cloud elements are properly aligned, but stock is showing bearish signs
- Tenkan Sen (blue line) is providing support on monthly chart with price above the cloud
- Tenkan Sen and Kijun Sen (red line) are flattening revealing recent stock price pressure and slowing momentum
- Leading cloud span is pointing toward sideways price action
Conclusion
Investors should start scaling out of $VNQ if price closes below Tenkan Sen (sell signal) which is currently at $79.23.
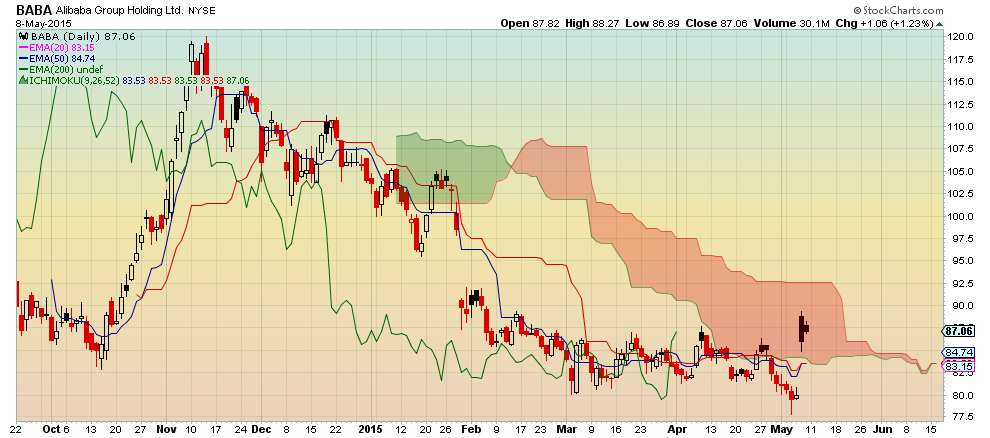
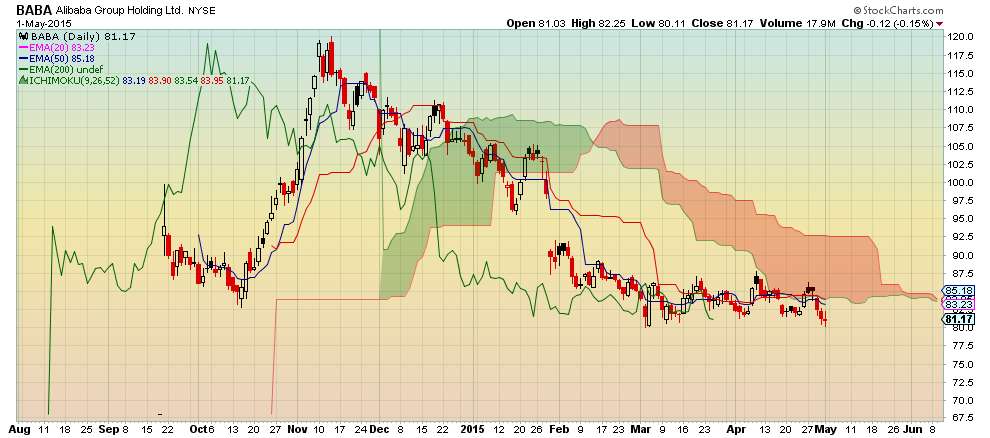
$BABA Ichimoku Cloud Analysis
$BABA is trading in a range of $80-$85 with no upside momentum. The Ichimoku Cloud is bearish and Tenkan Sen (blue line) is below Kijun Sen (red line) and the cloud's thickness offers strong resistance to the upside up to $92.50. The leading span is thinning due to the tight trading range, but is pointing downward. Chikou Span (closing price shifted 26 days in the past (green line) is below the price curve and further confirms the bearish state.
Conclusion
It would be best for investors to avoid this stock until it demonstrates some upside momentum.
Conclusion
It would be best for investors to avoid this stock until it demonstrates some upside momentum.
Friday, May 1, 2015
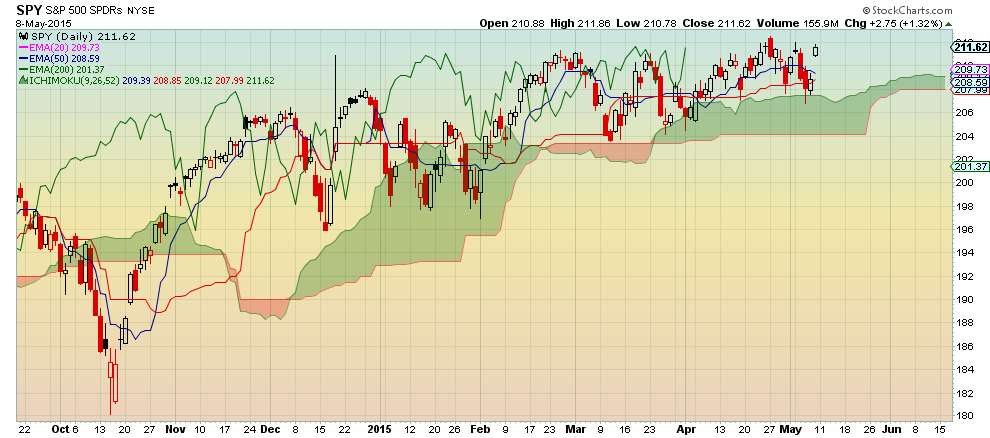
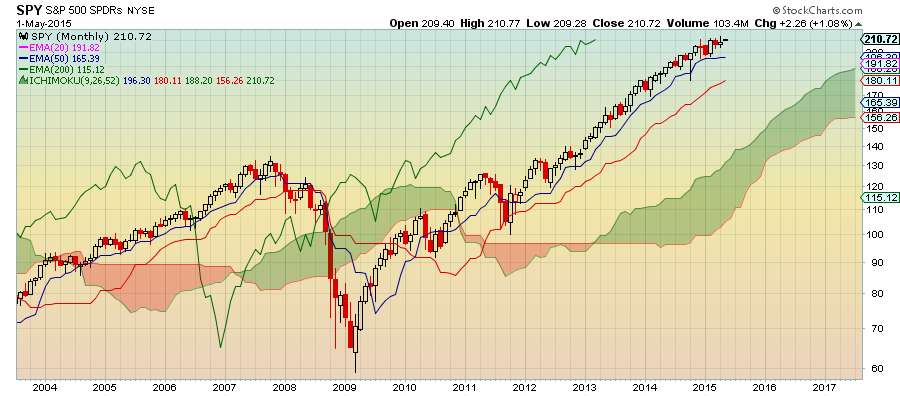
$SPY Ichimoku Cloud Analysis
Monthly Chart
$SPY remains in a long-term uptrend as all Ichimoku Cloud elements are properly aligned: Price curve is above Tenkan Sen (blue line); Tenkan Sen is above Kijun Sen (red line): Cloud is green. Flattening of Tenkan Sen reveals momentum is slowing.
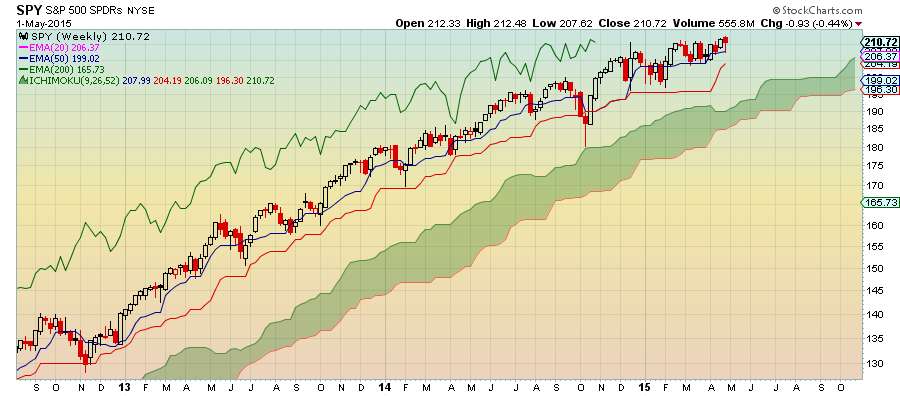
 Weekly Chart
$SPY weekly chart confirms that the medium-term is also bullish with Tenkan Sen (blue line) acting as support and Kijun Sen pointing upwards and rising. Cloud is green and leading cloud spans which are shifted 26 days in the future are pointing upward.
 Daily Chart
Daily chart reveals slight pullback, but with price remaining above the cloud which is bullish. Price bounced off Kijun Sen (red line) which provided support.
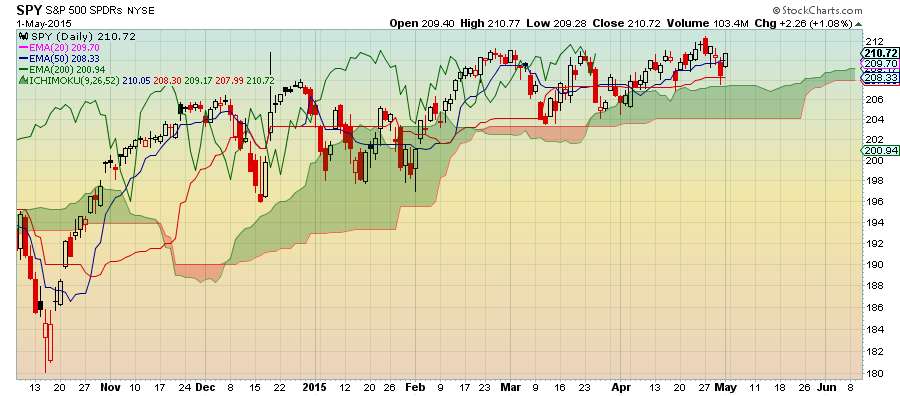
Conclusion
This may be an opportunity for investors to buy the dip. Scale in.
$SPY remains in a long-term uptrend as all Ichimoku Cloud elements are properly aligned: Price curve is above Tenkan Sen (blue line); Tenkan Sen is above Kijun Sen (red line): Cloud is green. Flattening of Tenkan Sen reveals momentum is slowing.
Weekly Chart$SPY weekly chart confirms that the medium-term is also bullish with Tenkan Sen (blue line) acting as support and Kijun Sen pointing upwards and rising. Cloud is green and leading cloud spans which are shifted 26 days in the future are pointing upward.
Daily ChartDaily chart reveals slight pullback, but with price remaining above the cloud which is bullish. Price bounced off Kijun Sen (red line) which provided support.
Conclusion
This may be an opportunity for investors to buy the dip. Scale in.
Subscribe to:
Posts (Atom)