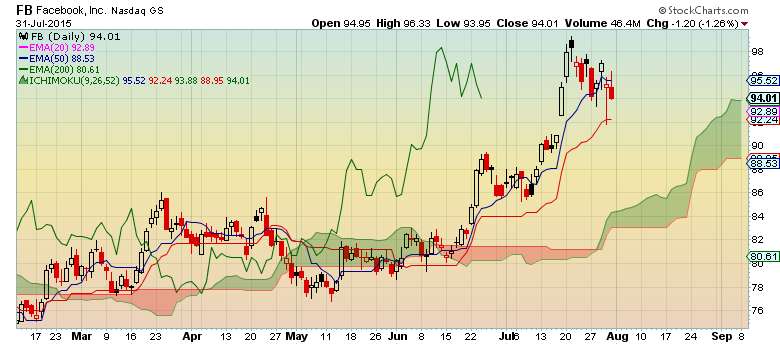
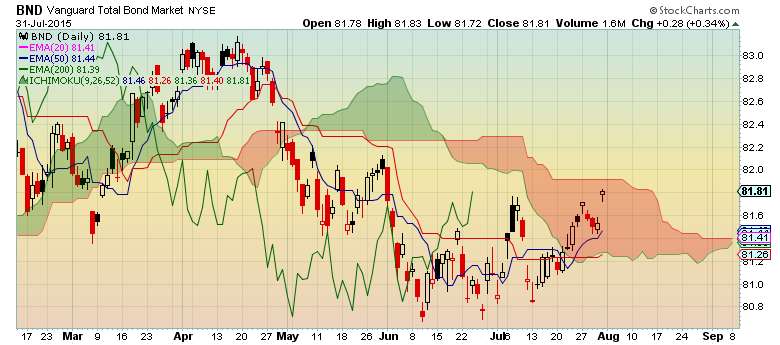
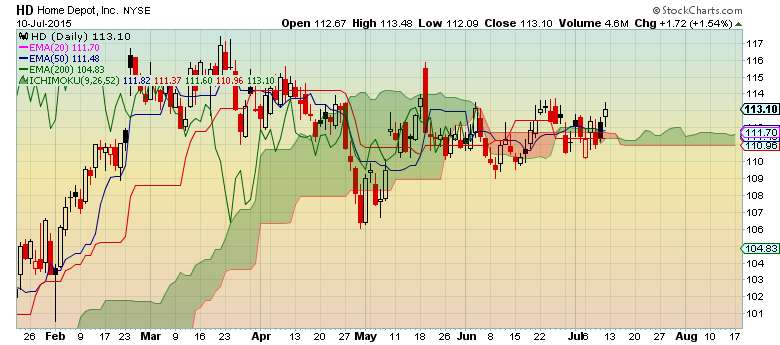
Daily Chart
- Bullish trend since mid-July
- An exit above the cloud will turn the chart more bullish
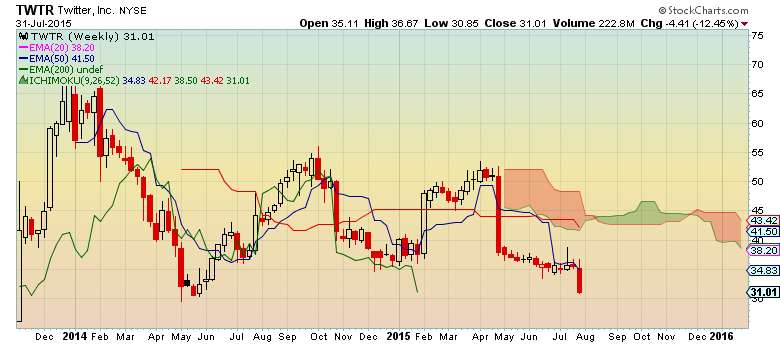
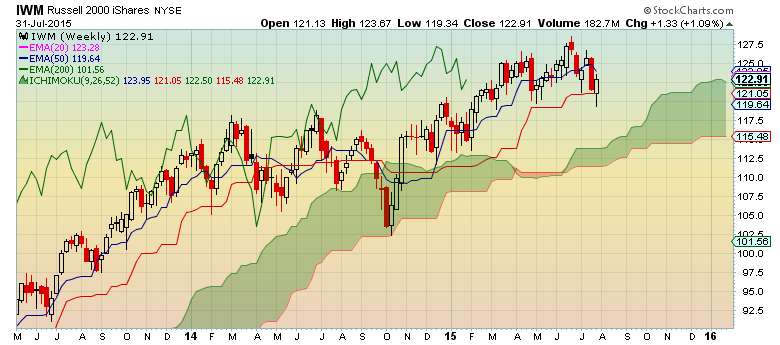
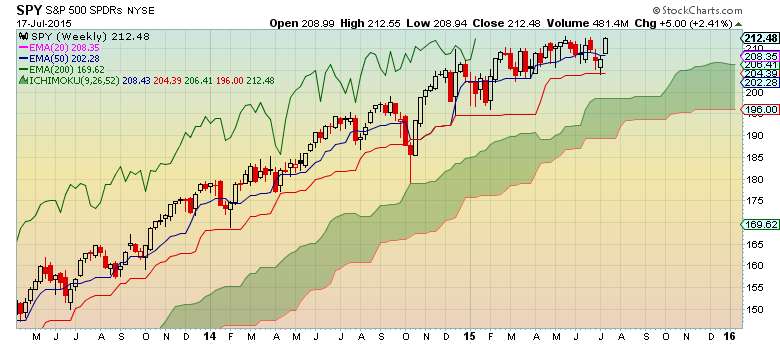
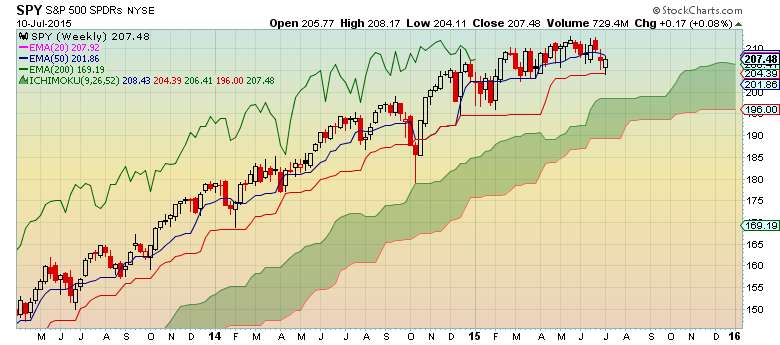
Weekly Chart
- Price closes slightly above the cloud which is bullish
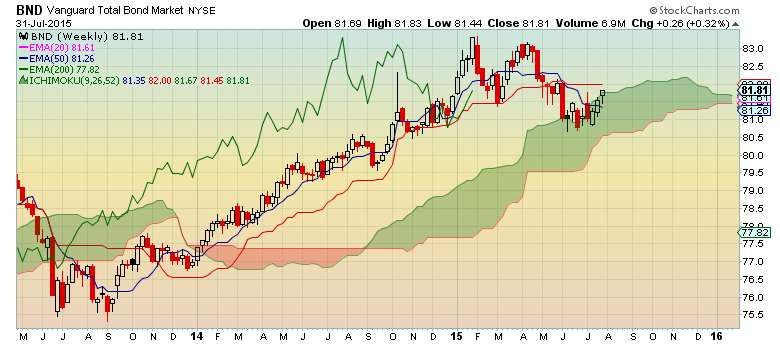
- If you missed shorting it on Friday, don't worry there may be another chance.
- Traders may now have a potential buying opportunity for a quick, but limited profit. Wait for your signal.
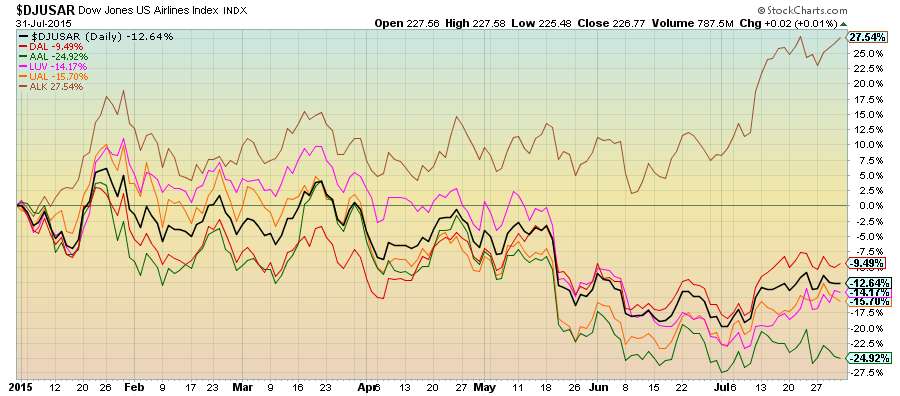
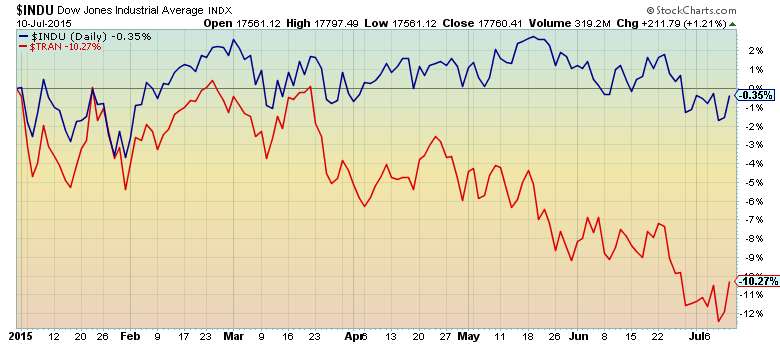
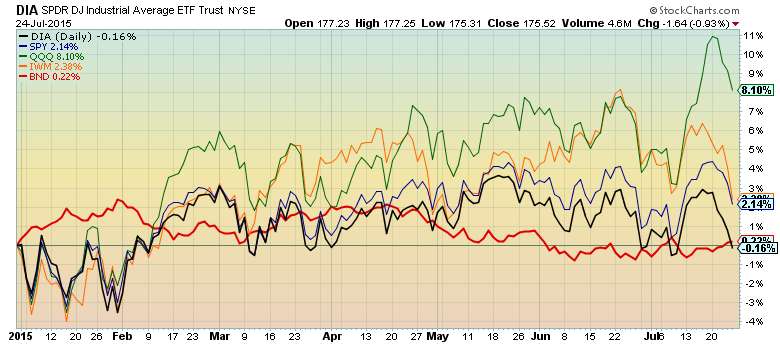
- YTD performance confirms that the market is bullish, but market uncertainty has tempered overall returns
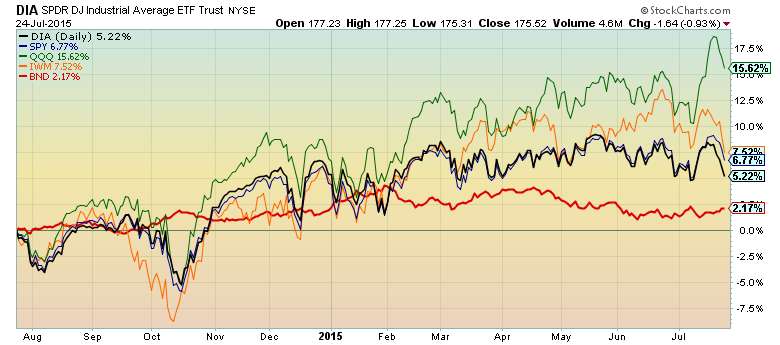
YTD 1-YEAR
Performance Performance
$DIA -0.16% +5.22%
$SPY +2.14% +6.77%
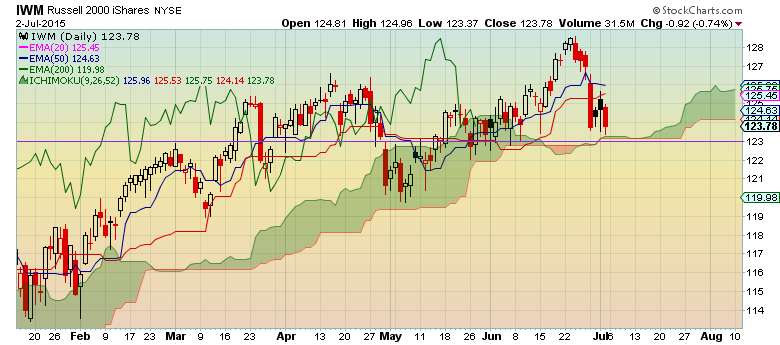
$IWM +2.38% +7.52%
$QQQ +8.10% +15.62%
$BND +0.16% +2.17%
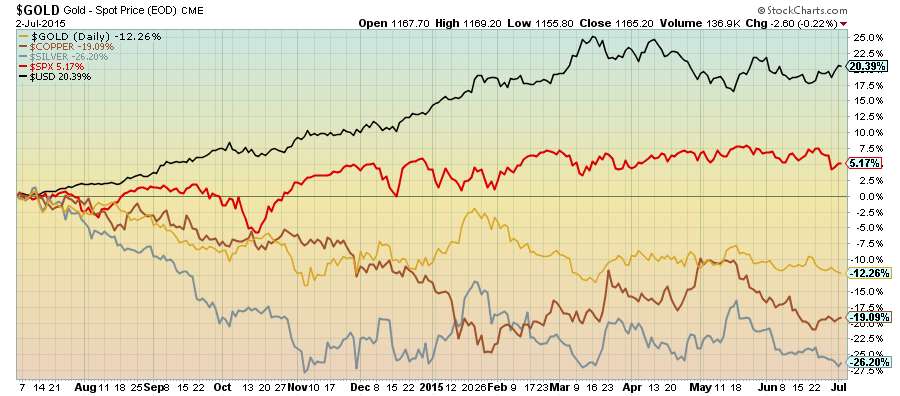
Year-To-Date Performance
1-Year Performance
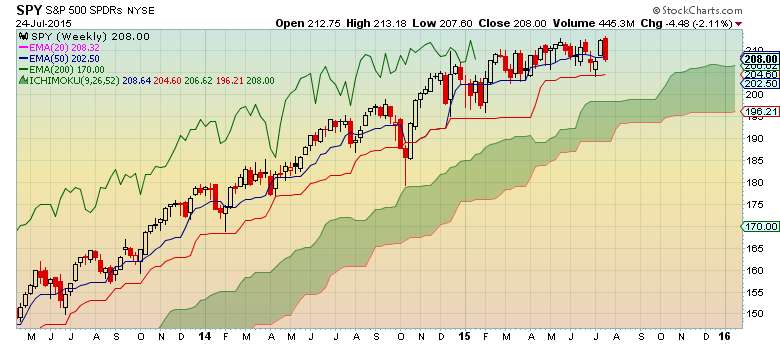
Weekly Chart
- Weekly chart remains bullish
- A close below Kijun Sen (red line) would be troublesome
- Watch closely due to bearish engulfing candlestick
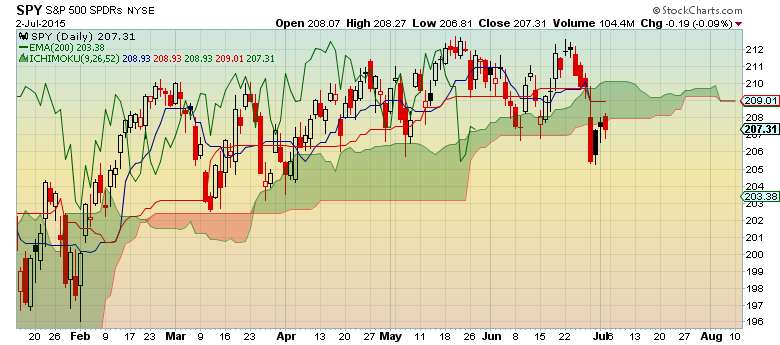
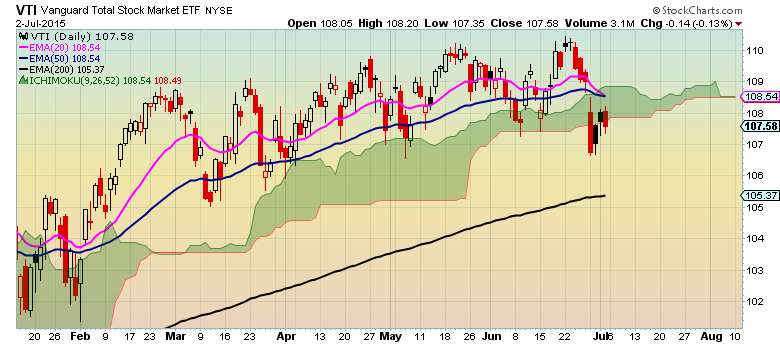
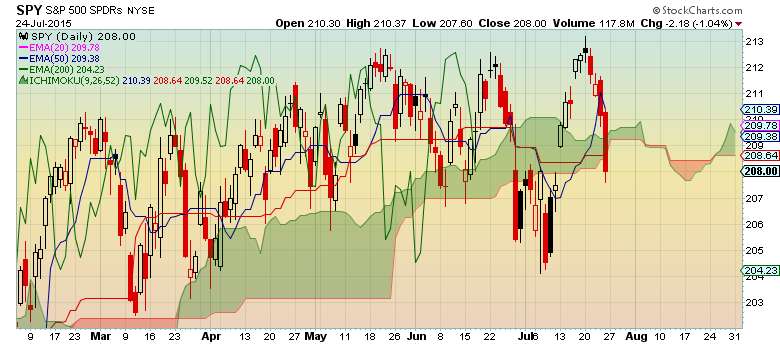
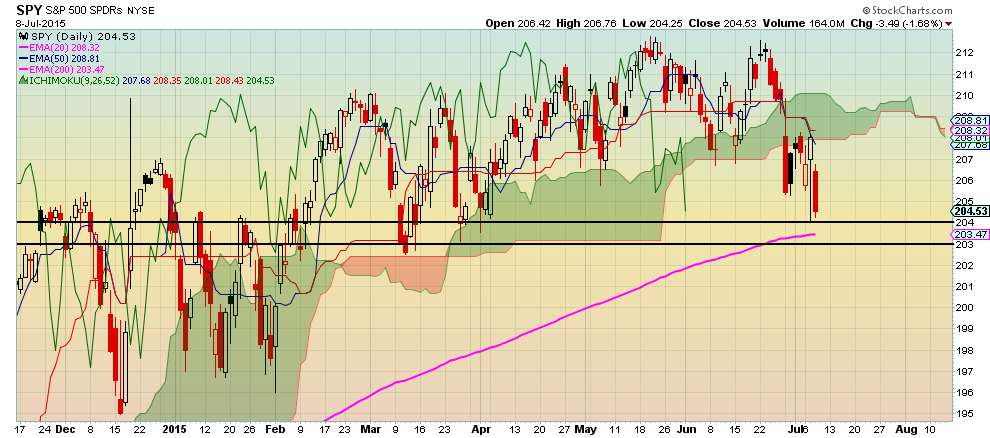
Daily Chart
- Bearish tilt since price closed below the cloud
- Not completely bearish due to other cloud elements
- Chikou Span closing below the cloud can be used as confirmation and it is currently above the cloud
- Initial support around $203-$204 if market breaks down
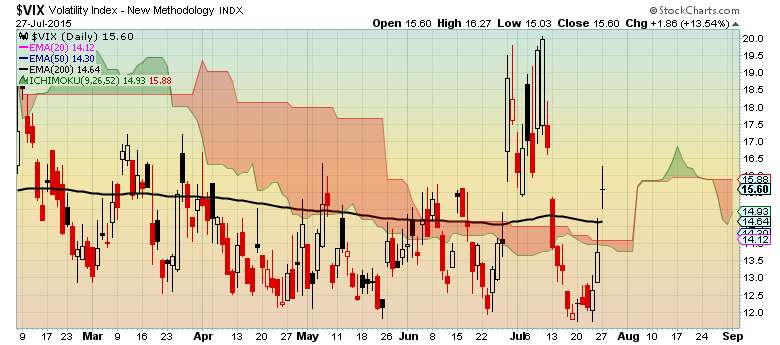
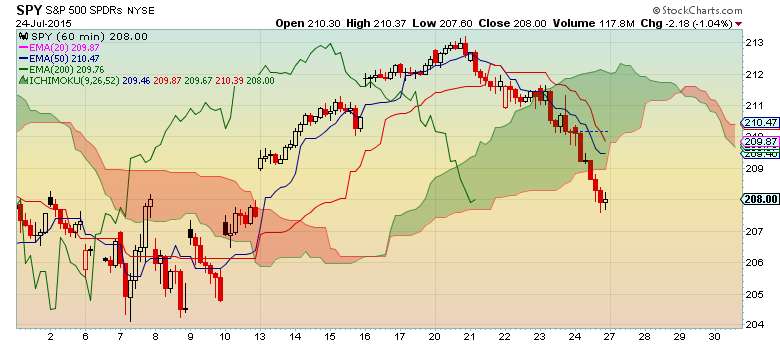
Hourly Chart
- Bearish trend
- Chikou Span, Tenkan Sen, and Kijun Sen have not fallen below cloud yet which will completely turn the chart bearish
- Traded higher on Friday, but has not broken out of $110-$114 trading range
- Tenkan Sen (blue line) needs to start pointing upward for upward momentum
- Future Kumo is bullish, but still flat although Senkou Span A is tilting upward which is promising
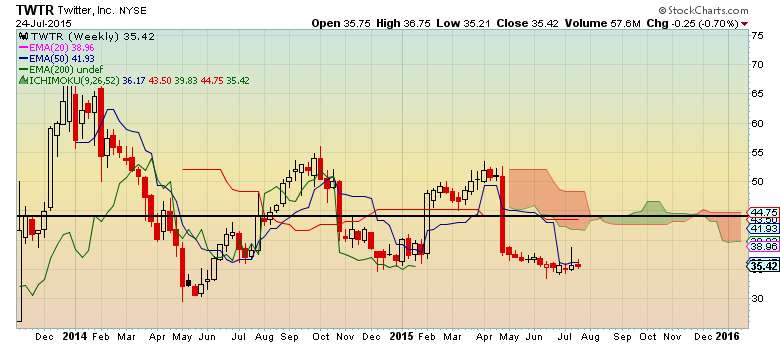
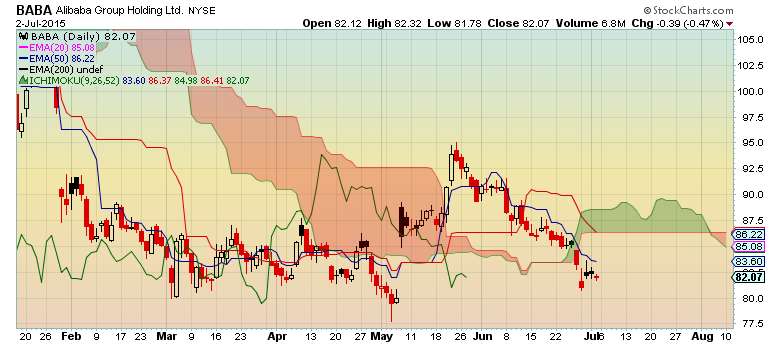
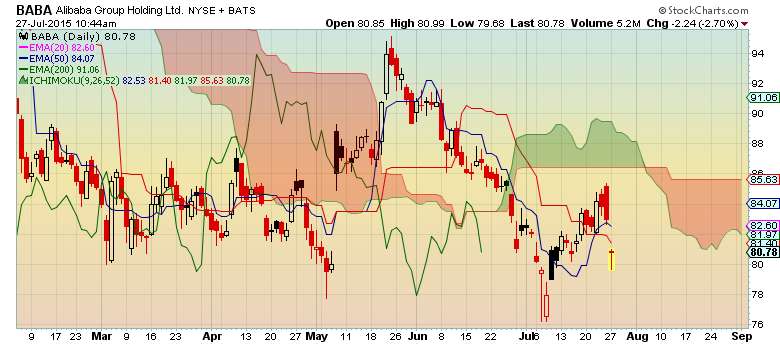
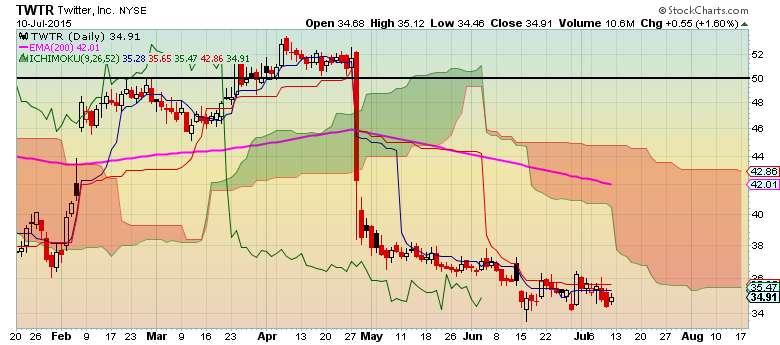
- Sentiment: Bearish
- % Below 200-EMA: -16.9%
- % increase needed to reach $50: 43%
- Probability of being below $50 over the next 50-days: 93%
Weekly Chart
- Sentiment: Bullish
- Kijun Sen is acting like support which is around $204
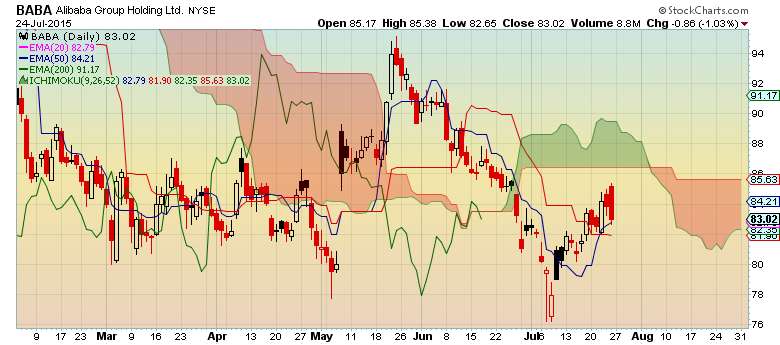
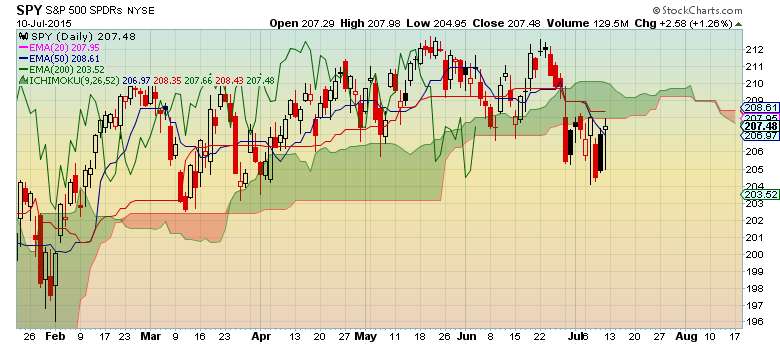
Daily Chart
- Sentiment: Bearish since price is below Kumo.
- Current Kumo is bullish while future Kumo is bearish
- Price seems to be finding support in the $204-$205 range
- A breakout above the cloud will confirm that the pullback has reversed
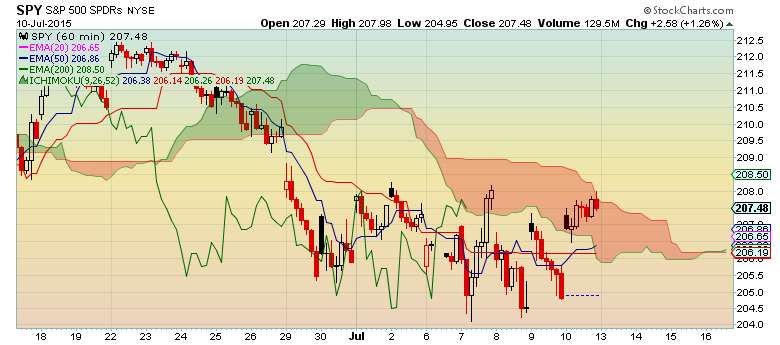
Hourly Chart
- Kumo breakout looming which is bullish
- Future Kumo has turned bullish
- A breakout above the cloud should carry over to daily chart to complete the reversal of the pullback
- Short-term trend is bearish
- Intermediate and long-term trends are still bullish
- Monitor market for bounce off support to improve risk/reward ratio
- A close below the support zone will turn intermediate term bearish
- A move into the cloud would show some upward momentum
- $SPY needs to move back above the cloud to turn bullish
- A close toward $203 would threaten the 200-day EMA