My 401K: S&P 500 - Keeping it simple by seeing the forest instead of the trees
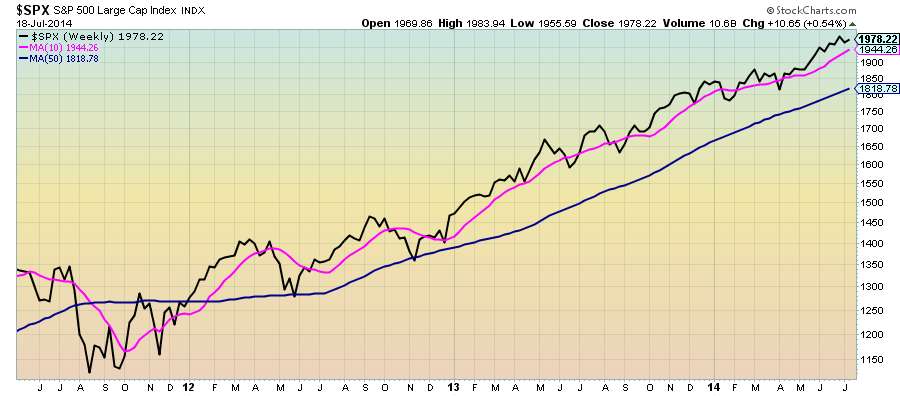
#my401K The chart below is the one I use the most to help me manage my 401K. It prevents me from reacting every time there is sensational news about the stock market's ups and downs. It's a weekly chart of the 10 week and 50 week simple moving average of the S&P 500 (I like things simple). Why the S&P 500? Well, it represents 500 of the largest companies in the stock market. If there are problems here, there are problems everywhere which is why it's a good gauge of the health of the market.
The chart helps me determine if I need to change the allocation of stock funds in my investments. As long as the pink line is above the blue line my stock fund allocation stays the same although I may re-balance among the stock funds in my plan. The black line which is the weekly price of the S&P 500 is my early warning signal that I may need to make an adjustment. When the black line crosses the pink line I start paying attention to the pink line and it's relationship to the blue line.
No comments:
Post a Comment