$SPY Multi-Timeframe Analysis - still in an uptrend despite bearish signs
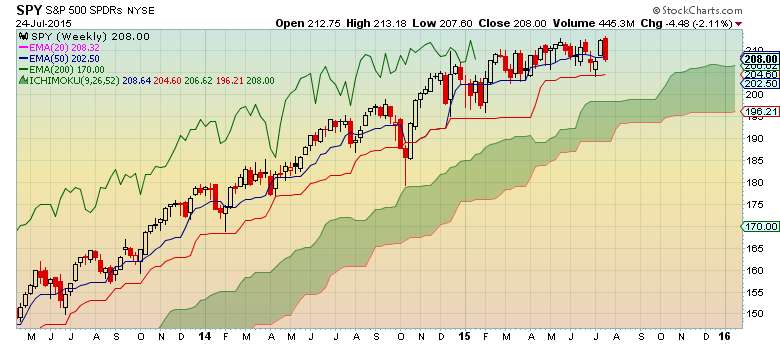
Weekly Chart
- Weekly chart remains bullish
- A close below Kijun Sen (red line) would be troublesome
- Watch closely due to bearish engulfing candlestick
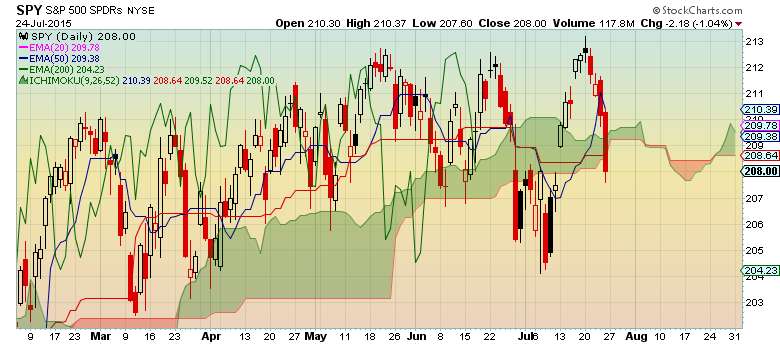
Daily Chart
- Bearish tilt since price closed below the cloud
- Not completely bearish due to other cloud elements
- Chikou Span closing below the cloud can be used as confirmation and it is currently above the cloud
- Initial support around $203-$204 if market breaks down
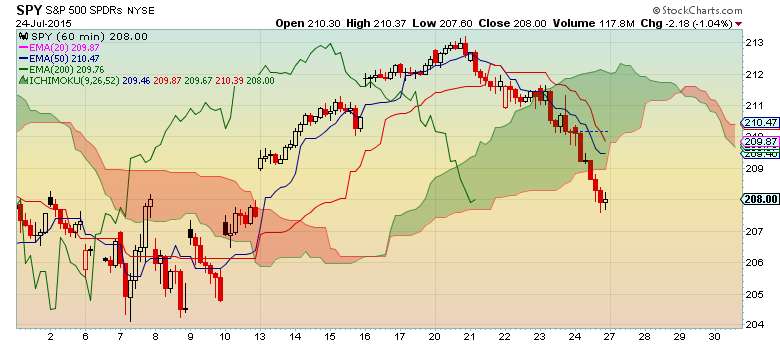
Hourly Chart
- Bearish trend
- Chikou Span, Tenkan Sen, and Kijun Sen have not fallen below cloud yet which will completely turn the chart bearish
No comments:
Post a Comment