ACD Financial
@acdfinancial on Twitter
Sunday, August 30, 2015
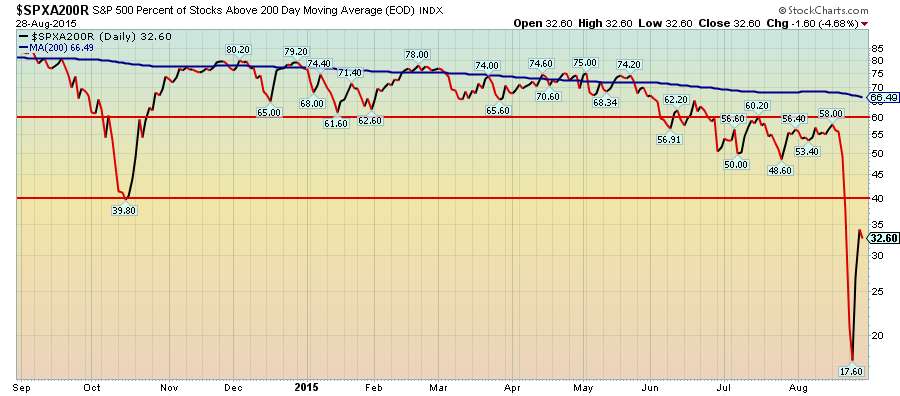
Almost 67% of S&P 500 stocks are below their 200 day moving average
33% of S&P 500 stocks are above their 200 day moving average
The red lines at 60% and 40% mark bull and bear territory for me
The % must rise and get above 60% for a reversal
No comments:
Post a Comment
Newer Post
Older Post
Home
Subscribe to:
Post Comments (Atom)
No comments:
Post a Comment