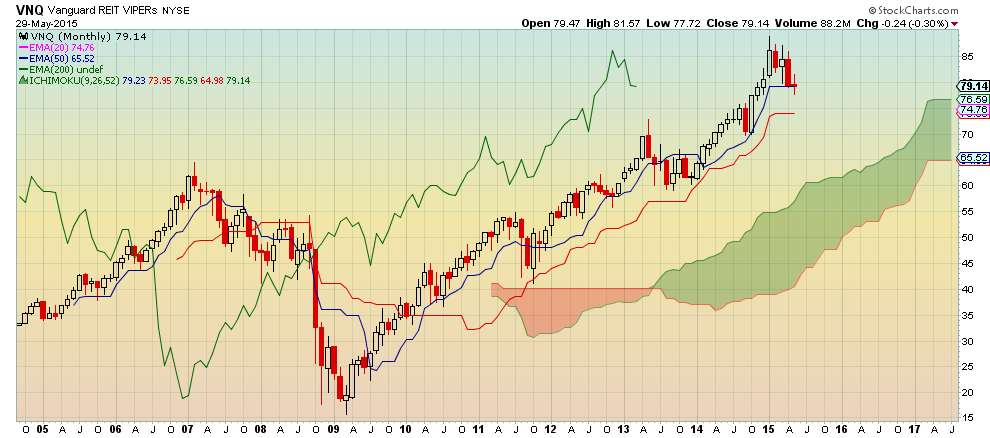
Monthly Chart
- Although $VNQ is bullish it's relative strength and upward momentum has slowed
- $VNQ is -1.71% year-to-date vs. +3.23% for $VOO (S&P 500)
- 1-year performance is +10.79% vs. +12.58% for $VOO
- Price has closed below Tenkan Sen (blue line) which represents the average of the high and low price over 9 months
- Both Tenkan Sen and Kijun Sen (red line) are flat implying no upward momentum
- Leading Kumo is slanted horizontally confirming flat momentum
Conclusion: Investors should sell $VNQ or at least reduce exposure and invest in a higher performing asset.
No comments:
Post a Comment