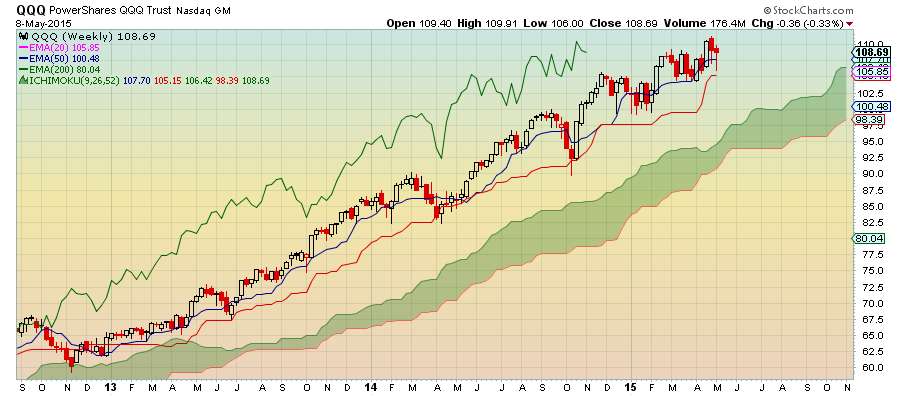
Weekly Chart
- $QQQ weekly chart is bullish as all Ichimoku Cloud elements are properly aligned
- Proper alignment on a higher timeframe chart increases the probability of a successful trade
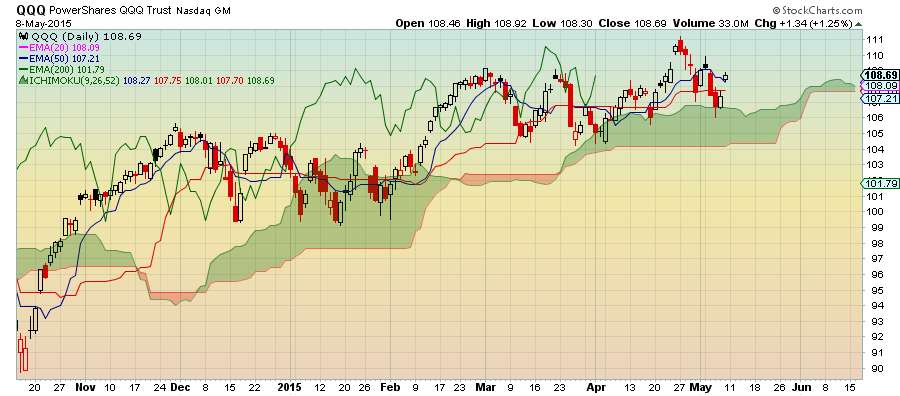
 Daily Chart
- $QQQ issues bullish signal on May 8 as price closed above Kijun Sen
- The ETF experienced resistance around $108 so this may act as support
- Kumo offers additional support after priced bounced off of it a few days ago
- Chikou Span adds further bullish confirmation since it is above the price curve from 26 days ago
No comments:
Post a Comment