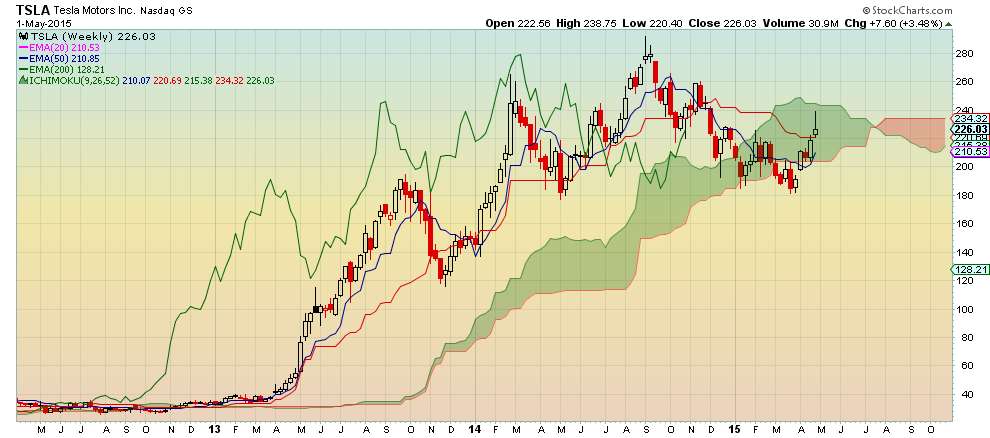
- Price is showing upward momentum and a bullish signal was issued when price crossed Kijun Sen (red line)
- Bullish signal is neutral since signal occurred in the cloud
- Leading cloud is red (Senkou Span A is below Senkou Span B), but Senkou Span A is pointing upward and cloud will change to green if it crosses Senkou Span B
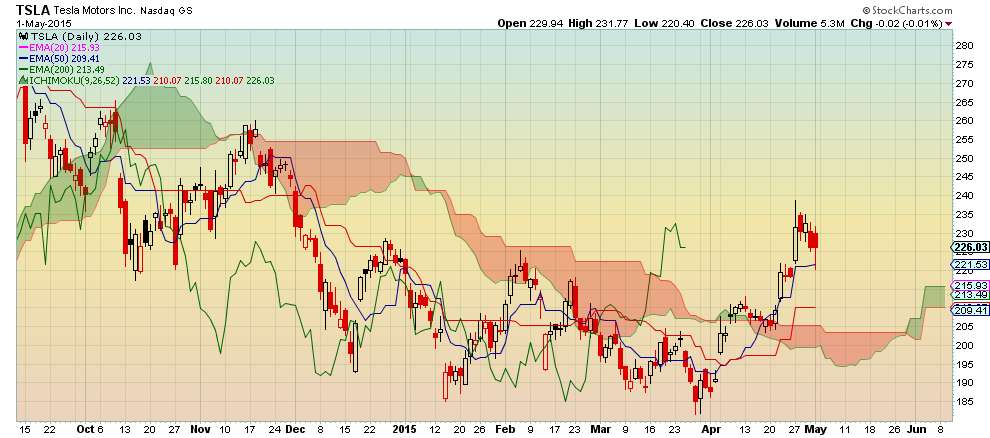
 Daily Chart
- $TSLA is now bullish on the daily chart after being bearish since October
- $TSLA's exit above the cloud turned overall sentiment to bullish
- Price is showing a slight pullback which may be a buying opportunity with Tenkan Sen pointing slightly upward while Kijun Sen is flat
- Leading cloud is green since Senkou Span A is above Senkou Span B
 Conclusion
Investors wishing to include $TSLA in their portfolio can scale in to manage risk.
No comments:
Post a Comment