Weekly Chart
- $VIX is bearish (price is below the cloud, cloud is red although it briefly turned green, and Tenkan Sen is below Kijun Sen, Chenkou Span confirmation)
- $VIX being bearish with a red cloud supports the bull market in stocks
- Spikes into and above the cloud correspond with market pullbacks and choppy trading

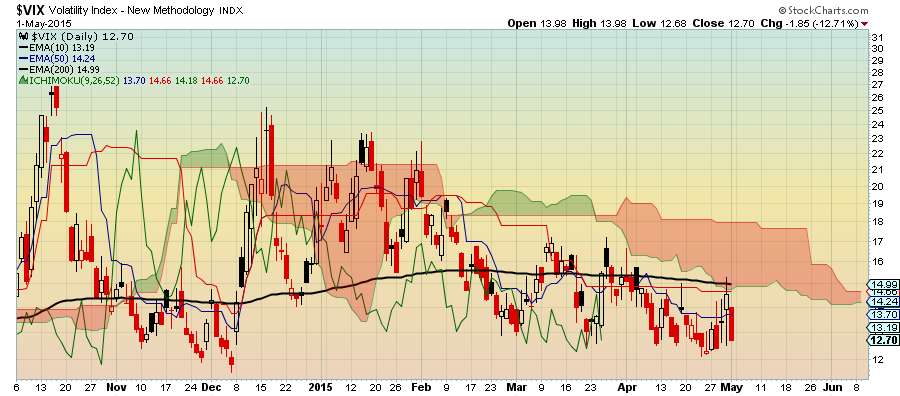
Daily Chart
- $VIX is bearish in daily chart and aligns with Weekly Chart (price is below the cloud and below 200 EMA, Tenkan Sen is below Kijun Sen, cloud is red, Chenkou Span bearish signal)
- This bodes well for the market since $VIX and the market are negatively correlated
- $VIX is mean reverting so $VIX at these price levels could be indicating a market top
- A spike above Kijun Sen and the 200 EMA will have a negative impact on stock prices
Conclusion
Investors should be cautious since the $VIX will spike at some point. Take some money off the table if you are a nimble investor and use it to buy dips and minor corrections. There is no shame in selling high and buying low.
No comments:
Post a Comment