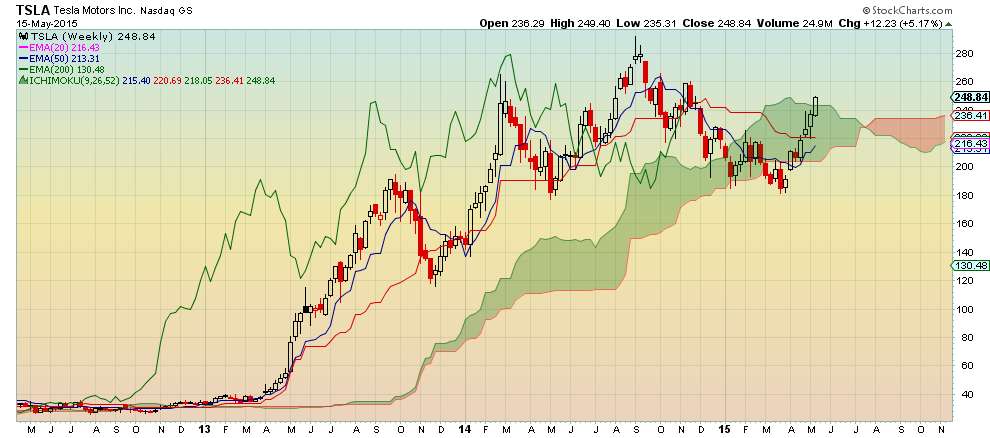
Weekly Chart
- $TSLA breaks above Kumo which is bullish adding more confirmation to the April 22 bullish signal
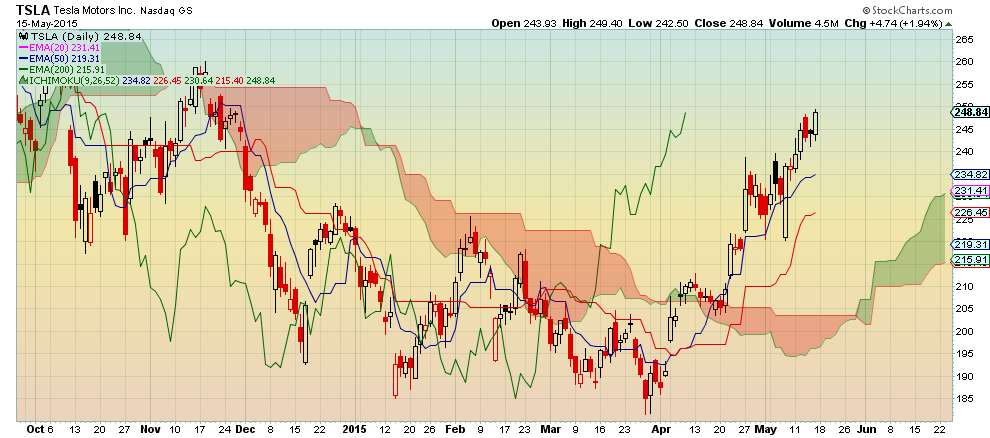
 Daily Chart
- Ichimoku Cloud bullish signal issued on April 22 as $TSLA broke above the Kumo
- $TSLA is up over 10% since the signal was issued
Conclusion
- All signs are bullish. Investors that missed out on the May 2 signal should be patient and wait for a pullback and scale in on the daily chart. Alternatively, analyze and utilize a lower timeframe chart (i.e hourly chart) to scale in.
No comments:
Post a Comment