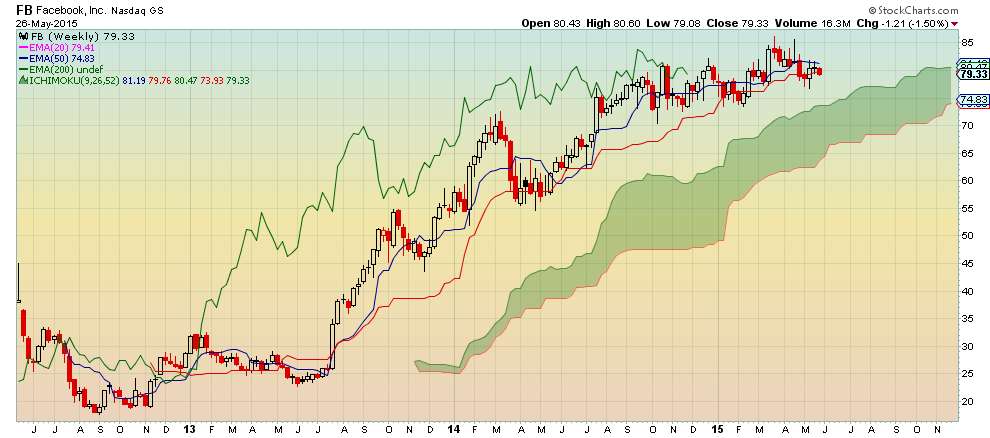
Weekly Chart
- $FB is still bullish on weekly chart despite price crossing below Kijun Sen
- Tenkan Sen (blue line) remains above Kijun Sen (red line) which is bullish for momentum
- Chikou Span (green line lagging 26 periods) is above the price curve - bullish
- Leading Kumo (cloud) is green - bullish
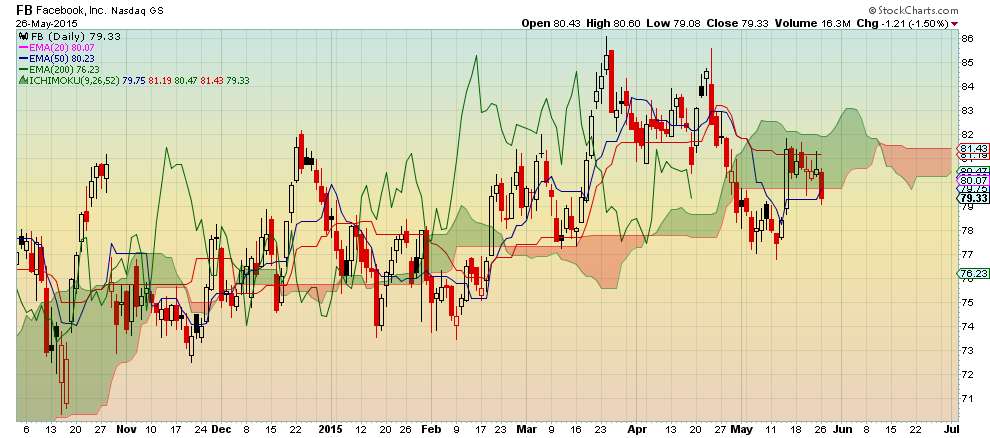
- $FB turned bearish on daily chart at the beginning of May with price crossing Kijun Sen and later confirmed by crossing below the Kumo
- Chikou Span confirmed bearishness as it crossed below the price curve
- Support seems to be around $78 before price entered back in the cloud and then closed below it
- With price showing support it may be a buying opportunity in an uptrend
No comments:
Post a Comment