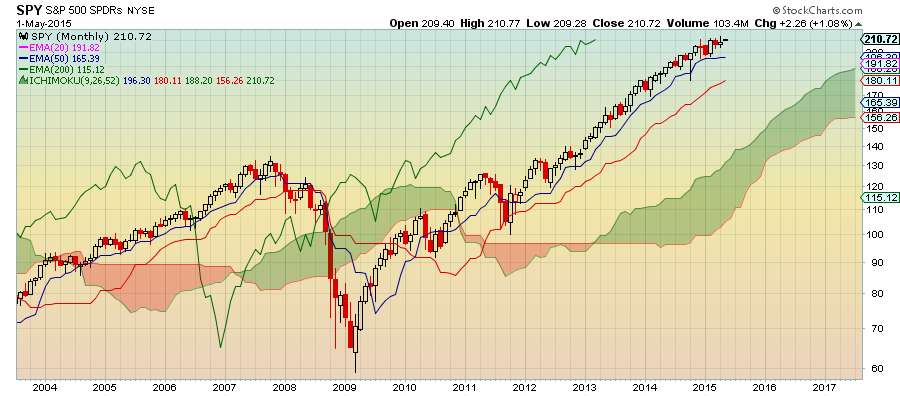
$SPY remains in a long-term uptrend as all Ichimoku Cloud elements are properly aligned: Price curve is above Tenkan Sen (blue line); Tenkan Sen is above Kijun Sen (red line): Cloud is green. Flattening of Tenkan Sen reveals momentum is slowing.
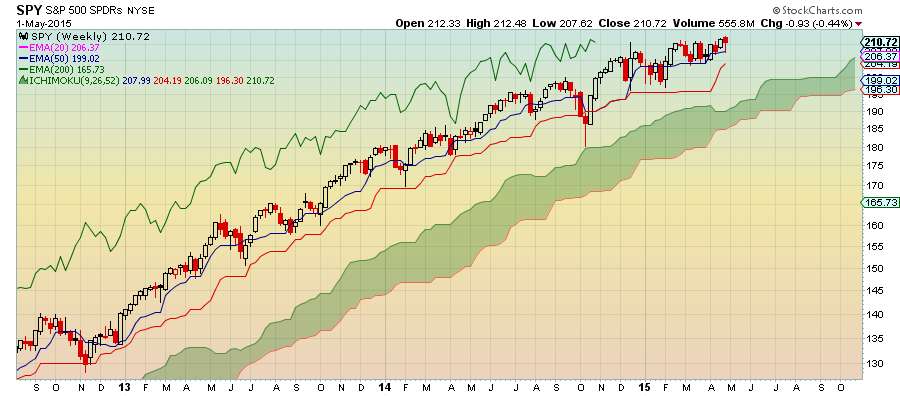
 Weekly Chart
$SPY weekly chart confirms that the medium-term is also bullish with Tenkan Sen (blue line) acting as support and Kijun Sen pointing upwards and rising. Cloud is green and leading cloud spans which are shifted 26 days in the future are pointing upward.
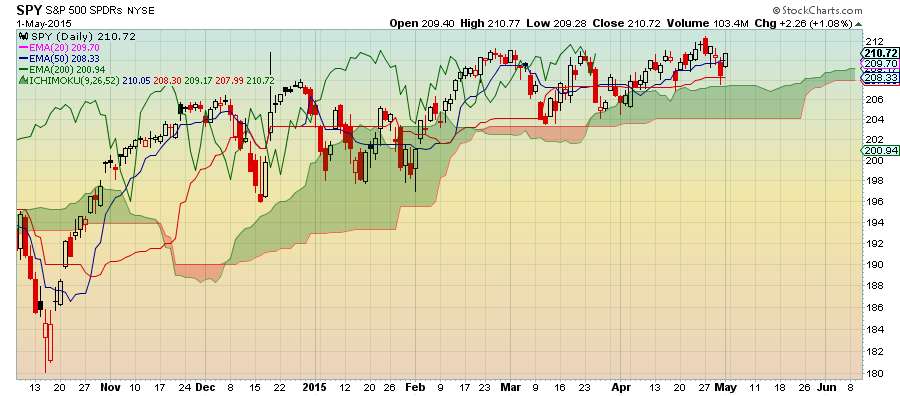
 Daily Chart
Daily chart reveals slight pullback, but with price remaining above the cloud which is bullish. Price bounced off Kijun Sen (red line) which provided support.
Conclusion
This may be an opportunity for investors to buy the dip. Scale in.
No comments:
Post a Comment