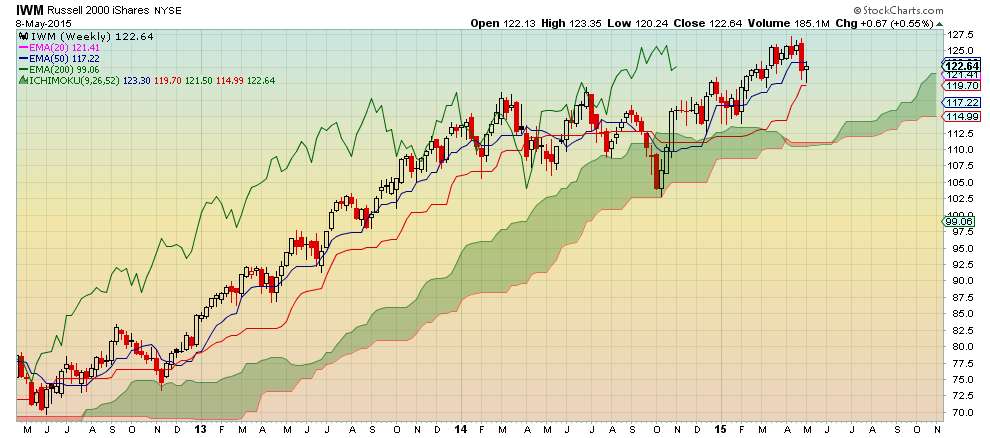
Weekly Chart
- $IWM is bullish since price is above the Kumo
- Red Kumo below price is thin indicating indecision, but overall Kumo is green and is slanted upwards
- Kijun Sen seems to be providing support which is around 120
 Daily Chart
- $IWM is trading in the Kumo despite rising +0.75% on May 8 indicating indecision on direction
- Tenkan Sen is below Kijun Sen which shows the decline in short-term momentum
- Senkou Span A is below Senkou Span B which supports bearish short-term sentiment
 Conclusion
This may be a buying opportunity for aggressive traders. Nimble traders should wait until price closes above the Kumo or until Tenkan Sen is above the Kumo before making a trade.
No comments:
Post a Comment